Hello, I'm pretty new to plugin development. I'd like to receive my chamber temperature via MQTT from a esp8266 and show the temperature within the navbar.
I've read the online docs, did the example, reviewed the MQTT an navbar-temp plugins and wrote a plugin close to navbar-temp.
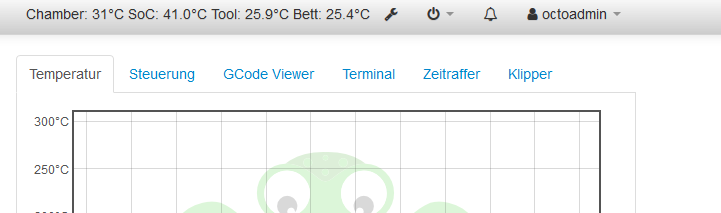
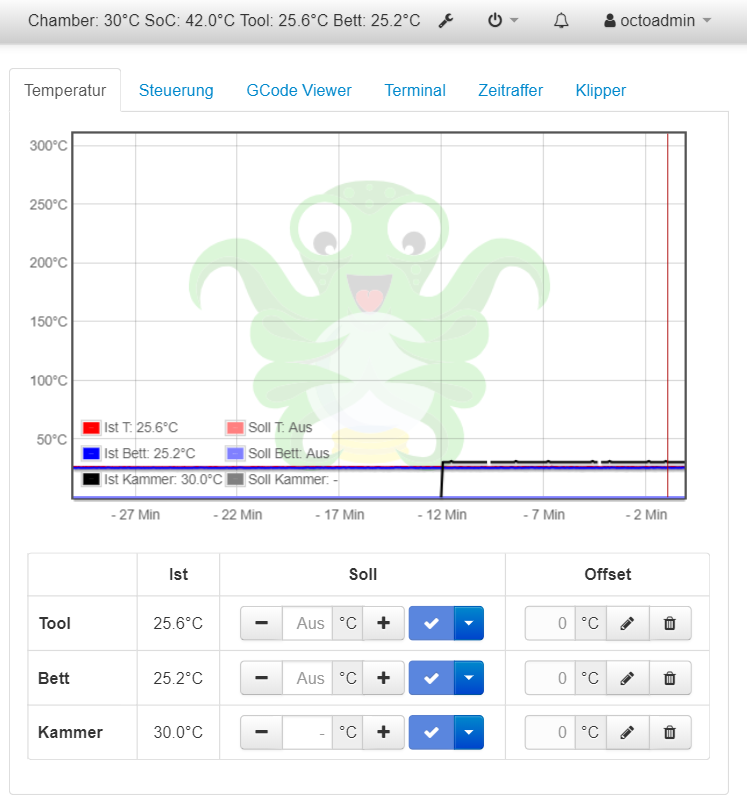
In the result, after loading the Plugin, the temperature is shown in the navbar, but the system menu is gone, the loggedin user is not shown and login does not work.
Dropping my template jinja2 brings the menu and the user back to the ui.
The logs are fine and in DEBUG mode the log shows the successful userlogin after startup. What I didn't get till yet?
Plugin and Picture ->
OctoPrint-Chambertemp.zip (33.1 KB)
It's a good idea to check the JavaScript console in your browser to make sure that there aren't any errors ("error binding ... view...").
indeed:
Could not bind view model NavigationViewModel to target #navbar : Error: You cannot apply bindings multiple times to the same element.
hmmm. there was a hit within the example I think, lets see ..
Thank you :)
this is indeed stuff I didn't really get right now.
why do I need the "navbar" line in the Tutorial and now don't?
The "settings" may keep in place.
    def get_template_configs(self):
        return [
#          dict(type="navbar", custom_bindings=False),
            dict(type="settings", custom_bindings=False)
        ]
Running it like this does your navbar code still work?
At this point, you might want to review your JavaScript file that's named something like YOURID.js and look at the code where it's trying to create the viewmodel. The name at the top/bottom should match. None of the JavaScript should have errors in it. (Comment out sections in the middle to help troubleshoot.)
Also, check out your YOURID_navbar.jinja2 and make sure that it's not trying to reference something weird.
Just setting this remark brings it up without error and the missing ui items back on site, but I didn't get the reason. In the example tutorial they're talking about this bindings but with another context in my opinion.
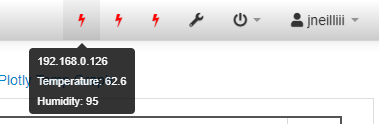
Cool plugin. Similar to what I'm doing integrating those capabilities in my Tasmota plugin. Current dev version should be able to display sensor data and energy monitoring data (untested) if it exists.
1 Like
You should add one which—upon hover-over—says "You're a wizard, Harry!"
Regarding the code... 
After this was solved the navbar issue I pushed the data into the temperature tab. Is there an Interface to achive this without manipulating temperature.js?
I'm working on a replacement graphing plugin that would allow you to do this, but it's still currently in development.
I've read the post about your plotting challenge, what is the reason for a complete new apporach?
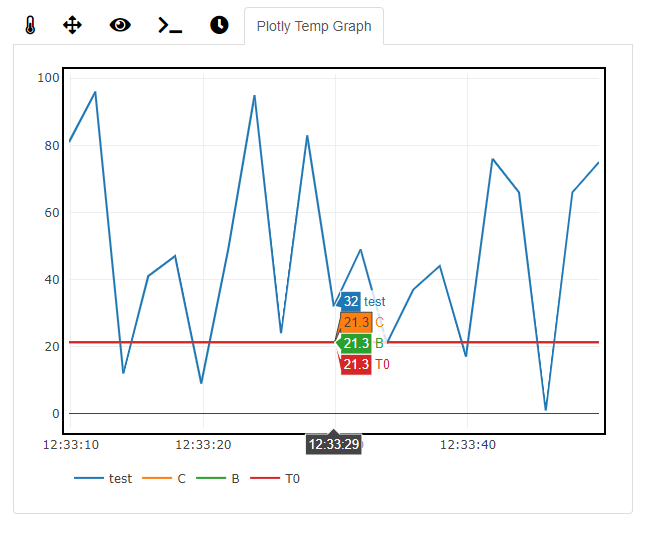
Really it's just because I'm more familiar with the plotly library and figured it would be quicker to implement then learning how to do it with flot js library. I have a working solution now that is able to graph additional lines on the graph using the octoprint-comm-protocol-temperatures-received hook.If another plugin injects it's temperatures into the parsed_temps return variable then my plugin will be able to graph it, as long as the injection happens prior to my plugin's callback. This is an example plugin I wrote just for testing that injects a random number.
import random

def callback(comm, parsed_temps):
	parsed_temps.update(test = (random.randint(1,101),random.randint(1,101)))
	return parsed_temps

__plugin_name__ = "Test Plotly Graph"
__plugin_version__ = "0.1.0"
__plugin_hooks__ = {
	"octoprint.comm.protocol.temperatures.received": (callback, 1)
}
and the result looks like this...
If you want to try and integrate into that you can find the plugin at the link below. The only caveat is the execution order of the hook callback, you need to make sure your hook declaration has the tuple defined (callback, 1) so my plugin gets the data after that. You also want to avoid any long running processes in the callback, so best to have your data queued up already when the callback is ran and that way you are just pulling from queued data.
I'm also planning on incorporating an api that data can be sent to it outside of a plugin, but haven't started that part yet.
Nice idea and thank you for the offer, but it doesn't meet my goals.
I'd like controlling my chamber temp preferably pretty close to the solution via firmware.
E.g. actual Temp in Temp Tab, show the graph and set the Target as a limit Temperature.
I achieved this with adding/changing about 10 lines into temperature.js and blocking M141 in Klipper FW. It's not nice (indeed a dirty hack) but it works.
The nice way seems adapting settings and the comm class, but this is a journey though a couple of files. In the result: a lot effort with low additional benefit and all gone by the next update. Putting it clean into a Plugin seems not possible to me at present.