Does anyone know of a plugin that can monitor the CPU temperature & CPU load of a Pi and plot it on a graph? I already use the dashboard plugin which shows current temperature & load but I would find graphing really useful, especially as i'm trying to diagnose a few issues at the moment!
Not in any plugin that I'm aware of.
You can certainly set it up externally using snmp or Telegraph and the TICK stack or similar.
I have InfluxDB and Grafana on a separate LXC container in my homelab doing this. It would be very nifty to have a timeseries db running on the RPi but i suspect that it would be too heavy.
The Navbar Temp plugin puts the CPU temperature in the navbar. I've used this one before.
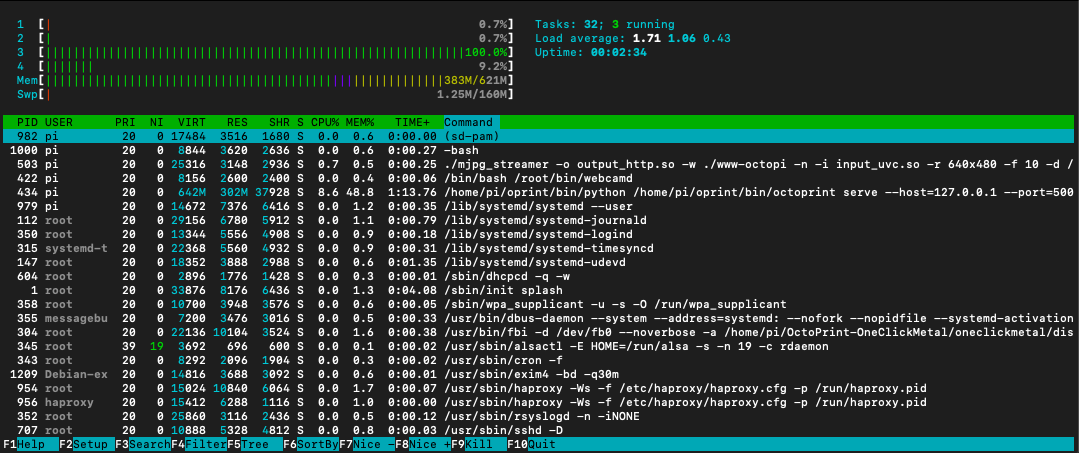
When coding, I open another terminal and run htop to determine how the CPU cores are doing. I also wrote a Conky display interface but that's probably overkill.
1 Like
Do you know this one?
I use htop a lot, actually. You want to press "H" to make all the subthreads pile up into one (OctoPrint on mine has at least 20 subthreads). You can then maybe sort by RAM used or filter for just "python", for example.
I'm running raspimonitor. Not a plug-in, but is web based. Gives you all the stats with graphing, history kept in a DB etc
1 Like
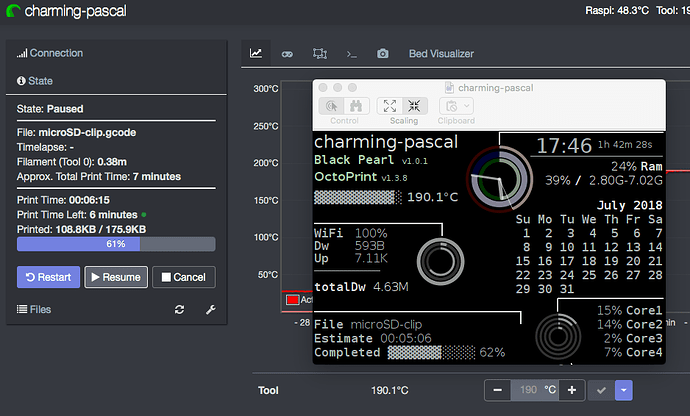
I mean this special version of htop 
Look at the pictures on github
Honestly, it looks like that.
(oprint) pi@octopi:~ $ htop --version
htop 2.2.0 - (C) 2004-2018 Hisham Muhammad
Released under the GNU GPL.

man htop
AUTHORS
       htop is developed by Hisham Muhammad <hisham@gobolinux.org>.

       This man page was written by Bartosz Fenski <fenio@o2.pl> for the Debian GNU/Linux distribution (but it may be used by others). It was updated
       by Hisham Muhammad, and later by Vincent Launchbury, who wrote the 'Columns' section.

htop 2.2.0                                                               2015                                                                 HTOP(1)
I guess it can't be, though, since the one you mentioned is back on 2.0.2-2.
It's what you get right out of the box with Raspbian; I don't recall installing this.
The one from my link got raspberry clock and temperature monitor options
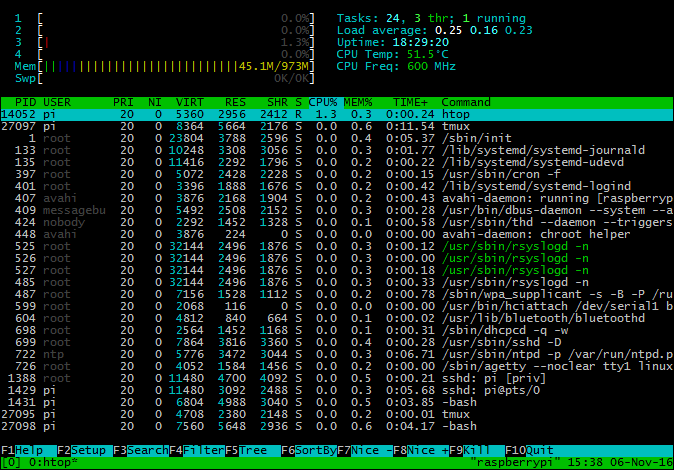
Look at the lines below uptime
1 Like
Well isn't that fancy. Maybe I should fork this thing and roll my own. For example, wouldn't it be nice to know the voltage?
1 Like
Tbh I hoped that you would say that and that you might port it to an up to date version of htop 

That would be awesome
If it's based on vcgencmd you can see all available options with vcgencmd commands
I know for a fact my own Pi will throw an undervoltage only when the microSD is writing to it. Having an indicator of microSD action (read/write) as a flag would be useful, I think.
Never heard of something like this
Does it trigger vcgencmd get_throttled?
How would you determine that the sd card is used and the cache isn't involved if you don't mind me asking?
Basically, I might do an rsync from my laptop to the Pi (pushing a folder's worth of changed code) and I would see the lightning bolt on the display. If I instead do a local ls -R * it wouldn't similarly do so; I deduced that the writing activity on the microSD was the cause. And it doesn't seem to be caused by lots of wifi activity, just the writing to the card.
1 Like
Wow thanks for all the replies guys, most of this looks a bit beyond me & I seem to have found the cause of the comms issues, turns out it was RFI related, My Ender 3 & OctoPi were plugged in to the same outlet as my fridge/freezer, which seems to throw out a spike when the compressor kicks in.
I'll check back on occasion to see if anyone puts together a plugin from any of the ideas floating about.
2 Likes