I've been thinking a lot during the development of the Dashboard and there are a few things I would like to address for a future version. I'm throwing this out both to get feedback and to see if someone would be willing to team up and explore the following possibilities.
The default UI space is tiny so it would be nice to be able to set up multiple boards for different purposes (printer, system, etc...).
A new version should be responsive and adapt to different window sizes instead of the current 3 column model.
Some kind of "component" framework for widgets would reduce code duplication.
The current template is pretty much hardcoded with limited possibilities for user customisation. Printers and systems vary a lot, so it would be nice if the users could re-arrange the dash content to their needs.
It would be very handy if the user could create a custom dashboard for pretty much any purpose.
A hook into the user system is required so fine-grained permissions can be applied. Any customization should require a specific user permission, limit view mode to specific dashboards, etc...
I've been thinking about the possibility to add a very light-weight time series database to store metrics in for the visualisations. I think it would be useful to select a time period for (i.e Last 5 minutes, Last Day, Current Print Job). An in-mem data structure would however be enough to start with.
It would be better to use the OctoPrint API directly instead of the viewModels if It would be possible to automate the configuration of the API authentication for a Plugin. I need to research that. It would also be very nice to configure and develop custom data sources both within and outside of the Octoprint instance.
A new version has to be more light-weight overall. It should have absolute minimal performance impact both on the backend and the frontend.
The code is pretty messy as I had absolutely zero knowledge about JS when starting (who am I kidding. I'm still clueless). A better structure is needed.
Given all the flexibility above, some sane defaults should be provided to get a working dashboard by simply installing the plugin without any other configuration.
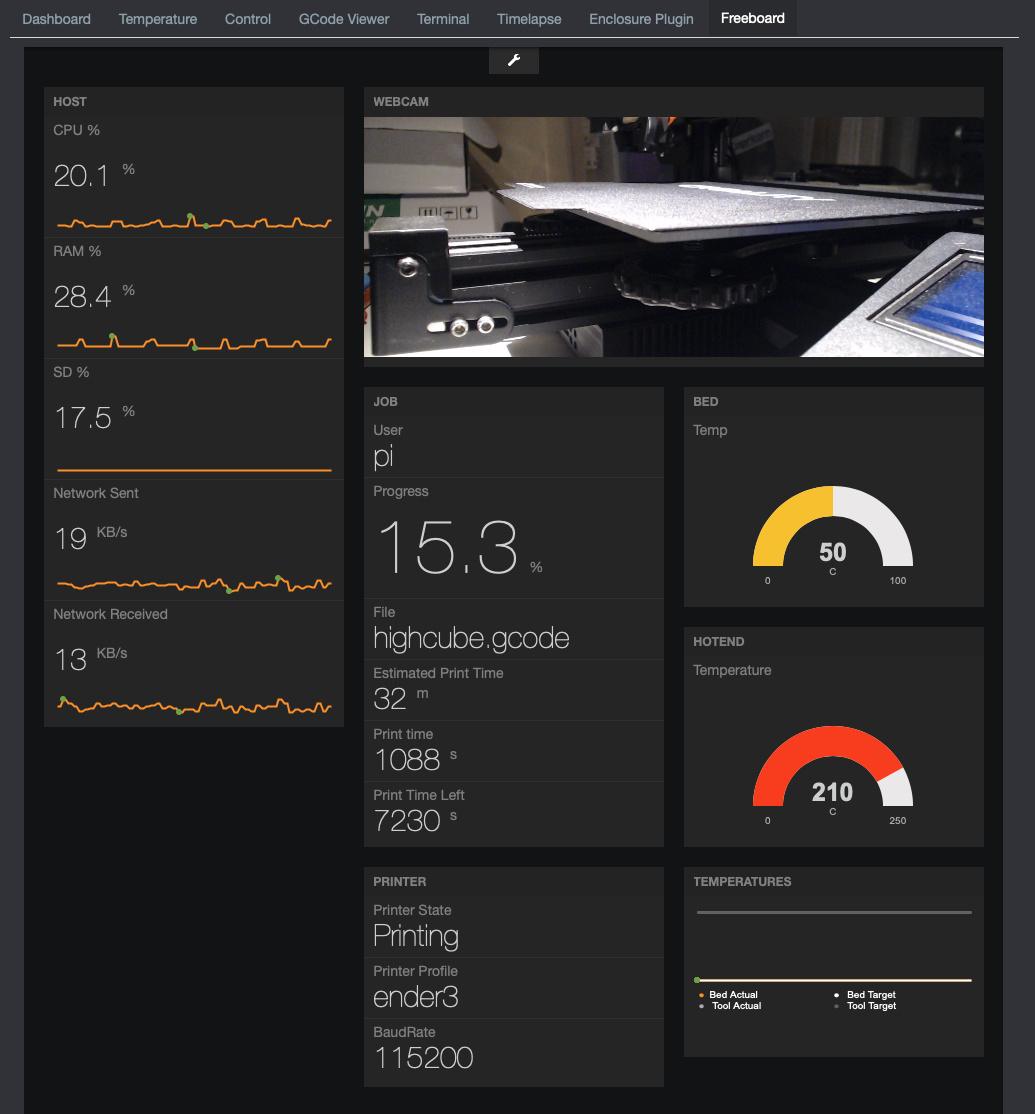
I've been playing around with freeboard (MIT license) a bit and it looks like it could meet many of the requirements above. Here's a mockup of a System dasboard based on a flask prof of concept by Max Woolf
Wouldn't that be contrary to the idea of a dashboard? I would think that a dashboard should give a user all the information needed for their workflow at a glance. Once you add multiple boards in the mix the user might as well just use the normal interface.
Good point. I'm thinking about it from the perspective of "drill-down" dashboards. Let's say you have an overview dashboard with more or less the content of the current dashboard. It contains an overview of system metrics, sensors, printer and job metrics etc. This is your at a glance overview if you will. Now you would like to get more details on the system metrics, so instead of adding more and more widgets to the main dashboard, we add a link to the "system" dashboard where you can get detailed info on for example network usage over time and possibly multiple network interfaces instead of just the current Rx/Tx throughput. The same can be said for sensors, etc and is applicable for anything that isn't already available in a standard or plugin tab.
The other reason is that the available space for a tab is really, really cramped, so it is kind of hard to fit in even the most useful metrics on one page without forcing scrolling.
Another perspective is that the possibility to create "custom" dashboards with "custom" data sources could open up the possibility for other plugin developers to (potentially) easily add a dashboard with some kind of standardised widgets (gauge, graph, text, etc) instead of developing an unique viewmodel and view (like i did).
If you're going to go that far, you might as well start looking into developing a UIPlugin mixin that replaces the entire web interface and build "widgets" that the user can pick and choose what to put on their own personalized dashboard.
If you're a developer then you truly care about the core-load and that of the RAM and swap space. If you're foosel and you're working on the new COM layer then you're going to love the idea of being able to monitor the bottleneck-that-is-serial. For me—working with Kivy—it's all about the available GPU memory for unobstructed memory blocks. For many, we're interested in the accumulation of serial errors that could be indicating a serial cable problem. For a person with a new printer install, they'd need to know about undervoltage incidents. For someone running a printer farm, they might be interested in overall health and ETA on that print job. For someone running a printer rental shop, they might be interested in WHOSE job is running and the name of the print job as the most important information on the screen. If you're a youtuber and constantly run timelapses then you're probably worried about running out of space on that ext4 partition.
So everybody wants something. Each of us are bound to steer you in some direction which suits our own needs.
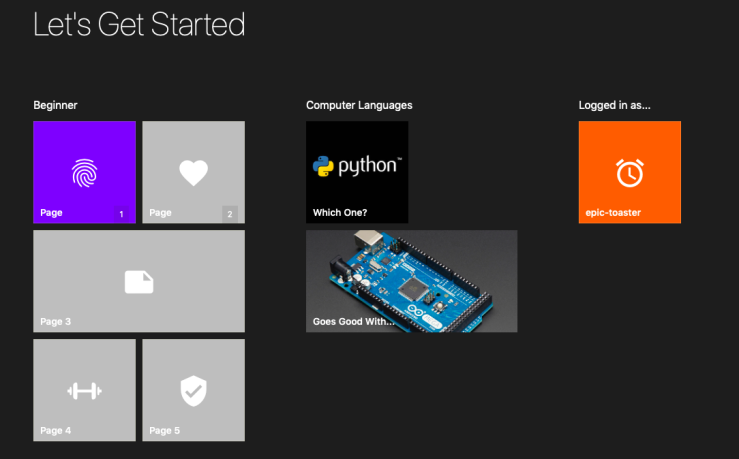
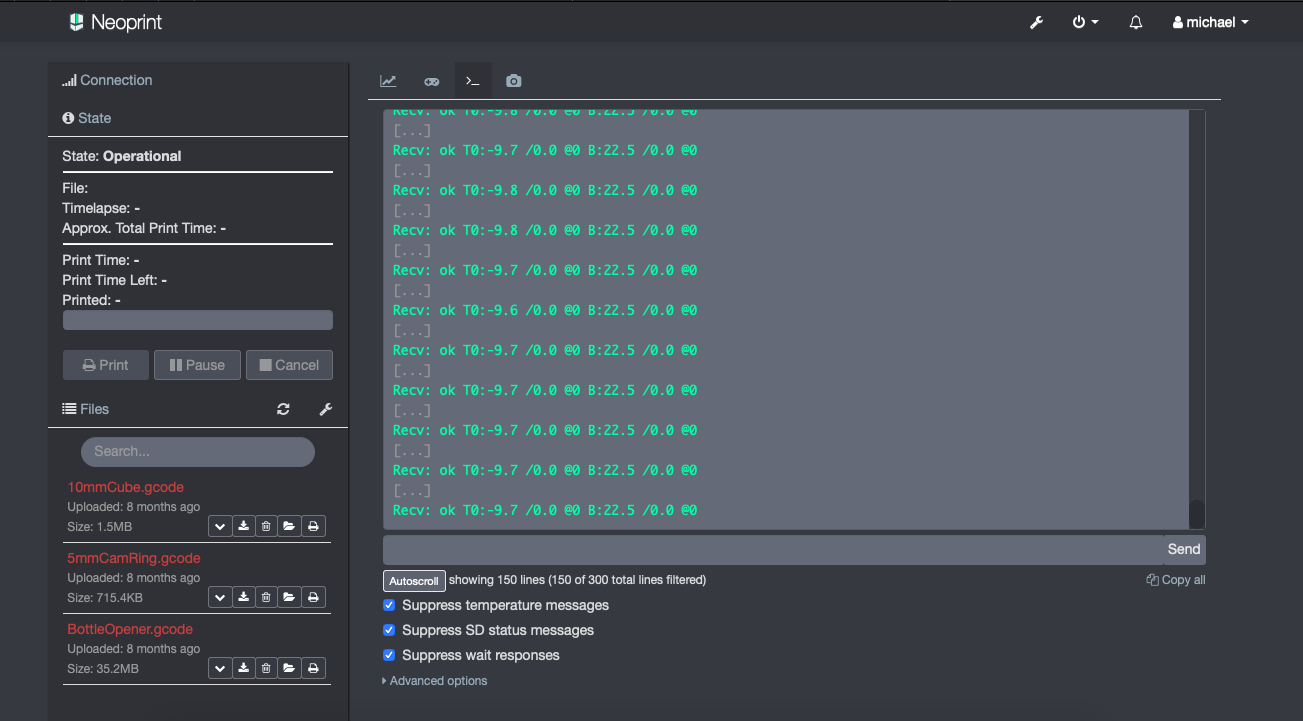
I like jneilliii's suggestion about a consumable widget concept. You'd then—as the enduser—subscribe to the widgets you're interested in. I might suggest a concept left over from the Windows Metro interface with respect to layout. See the first screenshot below. Each widget would know its size (1x1, 1x2), the user would add widgets in the order they want with the possibility of changing that order later. The layout should be responsive and adjust if the user has set a fullscreen/landscape mode and with Themeify, widened the right-hand section of the standard OctoPrint web interface. (See the last screenshot below.) Many people do this, btw. I usually minimize the Files side panel widget after selecting one to print, leaving the left-hand side sparse.
I know you mentioned before different frameworks that you personally would look into. Could you remind us of what those were? I've also seen several people mention vue.js, which from what I can tell is the rough equivalent of knockout? I've looked at the UIPlugin mixin before but never could wrap my head around how it worked for retrieving information. Is there some callback that has all the current data coming from the printer being sent to that or would that have to be built in utilizing API calls for pulling data?
You'd have to implement all the data querying yourself (or use the existing client js lib that's part of the assets), UIPlugin basically provides different HTML on the root path.
Thanks for all the feedback! I really appreciate it. I think I will at least implement a POC to illustrate the concept I have in mind. Maybe as a TemplatePlugin to start with as I haven't looked into the UIPlugin at all so far. I think that would make my intentions a bit more clear and hopefully also inspire further dialogue.
What do you think of the time-series db concept? Would that be useful for other features than the dashboard? I'm a bit concerned about SD wear for RPi users.
I have made a quick and dirty POC based on FreeBoard.io now. This is just to illustrate some of the concepts from my original post.
This first video shows how to add a custom data source and create a basic dashboard from scratch. The data source is in this case a small web service that exposes some PSUtil metrics over a rest interface on localhost but It can in theory be another plugin or the OctoPrint API (shown in the next video). I also created a couple of widgets from the data source and arranged them as a dashboard.
This custom dashboard can be saved and loaded programatically but I haven't implemented that yet.
And here is the third and final video where I load an existing dashboard that connects to the Printer, Job and Connection endpoints of the OctoPrint API. It also contains a set of host widgets from the first video. I also show how the user can re-arrange the dashboard(s) to their taste.
I have made some progress and more or less settled on using Packery for the layout. I've experimented some more and I now have the bits and pieces I think I need to stitch this together.
I haven't made any actual widgets yet (except a webcam and some dummies) but I can at least create a new dashboard, add widgets thru both UI and settings, It is now possible to rearrange the widgets using drag&drop and the layout is persisted in the backend across devices/sessions. It is also possible to set widget sizes at creation time.
One thing I thought might be a useful. It's more of an extension on the "Drill-down" dashboards. Have you thought about drilling-up?
There are many users of octoprint that run multiple printers, so it would be of use to have a basic dashboard (% complete, ETA, etc) for each printer on one single dashboard page. You could click on a printer displayed to be taken to the actual octoprint instance and dashboard for the printer selected.
Thanks for the feedback! I hadn't thought of that but I think that could work out of the box if i succeed with this (and add a hyperlink to widgets). Since one data source type is JSON you could just connect widgets to the API of another OctoPrint server to get the available metrics out of it.