Hello,
I have managed to get a DS18B20 temp sensor to work with the enclosure plugin and it succesfully reports enclosure temperature.
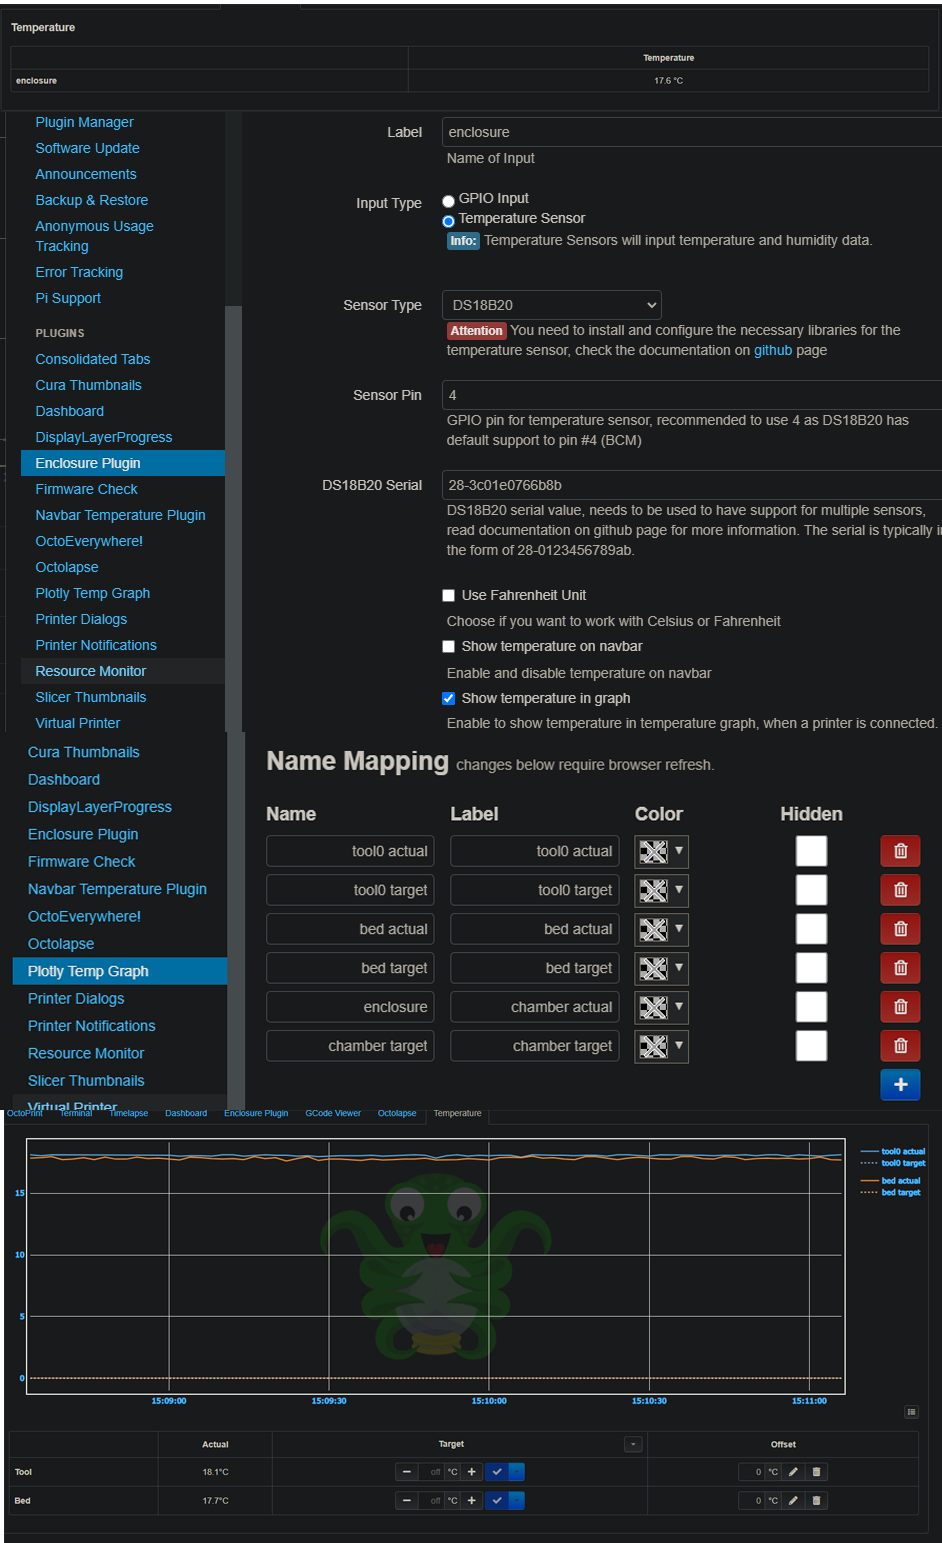
Next I wanted to plot the enclosure temperature into the graph and also add it below the hotend and bed temepratures, so I installed the enclosure fork which allows it to export into plotly plugin. However no matter what I do, it doesnt show up in a plotly graph. Am I doing anything wrong? Plugin settings in the pics down below. (As a new user, I had to add all the pics into 1 big media, sorry for that)
Thank you for any help!
I'm planning on fixing this in the plotly temp graph plugin to automatically add reported temps to the name map, but you need to add a name mapping to the list or it won't map what's being reported by the special enclosure plugin fork (assume that's the one you installed). The name to use for the new mapping is based on the label field from the enclosure plugin appended with actual, so in your case instead of just enclosure use enclosure actual.
Not sure if that sensor supports humidity too, but if it does, then enclosure humidity actual would be the other one you could add as well.
Thank you very much!
This worked wonderfully, had no idea. The sensor doesnt have humidity detection, although I do have a spare DHT22 lying around, but I havent been able to get it working with enclosure plugin, just fails to report temperature (even after following the steps on github). Thanks again!