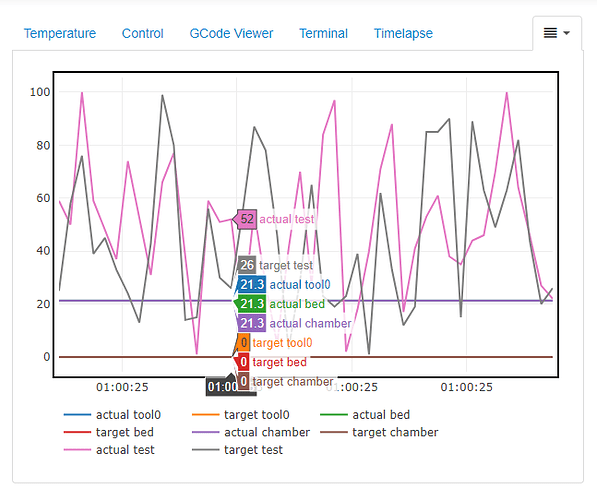
So reading the docs it seems that there is a method for setting execution order for hook callbacks to avoid being completed in order based on plugin name/identifier using a tuple. While testing this however, it seems there's no way to force your plugin hook callbacks to be executed last without naming it something like zzzzzzzzzzzzz because the plugins that don't specify an order are always appended to the end of the callback list by name after the other ordered ones. Is there a python trick I'm not familiar with that will allow my callback to be last?
Could you make the order -1, does that work?
Otherwise, search the forum for "zztop". :laugh:
I was thinking of that but haven't tried yet. I was part of that other conversation, I did get a good laugh from your name.
Uff, I honestly did never envision that someone might want to make sure they get executed at the end. I have no idea right now how to achieve that, sorry.
Thanks Gina. I'm not necessarily sure it will be an issue unless someone wants to integrate into the graphing plugin I was working on but thought I would ask. If the changes ever get merged upstream into a full replacement of the temp tab it wouldn't be an issue long term. As it stands now, I have it working with existing reported temperatures and have a working example of a plugin injecting data into the graph. Next steps are to replicate the existing graphing of historically stored data on load, add the control buttons for temperatures to mimic existing functionality and possibly add an api endpoint for injecting data outside of OctoPrint. I will probably be renaming it also as it may not just be temperatures that are being graphed.
I'll admit that this is actually something I've been thinking about 
Should I stop development if you are already looking into it? I had started to develop it just to take some work off your plate after seeing the issue post.
No, I was rather thinking about bundling it as a replacement if it looks like it might make sense. Taking things off my plate is definitely welcome.
Quick question @foosel, currently I'm using the self._plugin_manager.send_plugin_message method to send the temp data to the front end from the backend temperature received hook. Do you think that's going to cause any performance issues/memory leaks or the like that I should build in some form of throttling. Looking at the current temp tab, it seems that the viewmodel is updating based on a knockout subscription of the printer profile data to update the graph.
Actually currently it gets pushed the temperature data through the currentData push, and you ideally should somehow inject into that (that will need adjustments in OctoPrint though).
I think pushing all the temperature data as a plugin message could cause serious performance issues.
Thanks, that's disappointing since I have a fully functional working graphing model now using the plugin messages...lol. I'll start dissecting the current temp tab implementation. My assumption is that most of the server side stuff is getting processed in the comm layer here? Seems like switching this to a loop on parsedTemps with if conditionals replacing the current key in dictionary approach and then adding a self.last_temperature.set_generic(name=name,actual=actual, target=target) would be a logical approach. I'm sure there's more down the line the deeper I get into the code.
I think I got it working now with fromCurrentData and fromHistoryData with some tweaks to the server back-end.
Need to figure out how to improve performance on it though, because on fromHistoryData it blocks the UI for a bit as it adds the traces to the graph. Of course, the longer the history the longer it takes.
Time to start looking deeper into your temperature viewmodel now I think.
Woo hoo! Performance issue resolved using array maps and graphing all the history data at once. Let it run over night and when I connected this morning it's just a slight delay, roughly the same time it takes for the flot graph.
Now to figure out these timestamps.
The earlier version looked like my brain on caffeine. ha
I think I'd recommend going with a color scheme for issuing series colors:
- tool0 actual/target: FF000080/FF0000FF two versions of red
- tool1 actual/target: EE330080/EE3300FF two versions of perhaps orangish
- bed actual/target: 33EE0080/33EE00FF two versions of perhaps greenish
- chamber actual/taget: 3333EE80/3333EEFF two versions of perhaps bluish
- test actual/target: etc
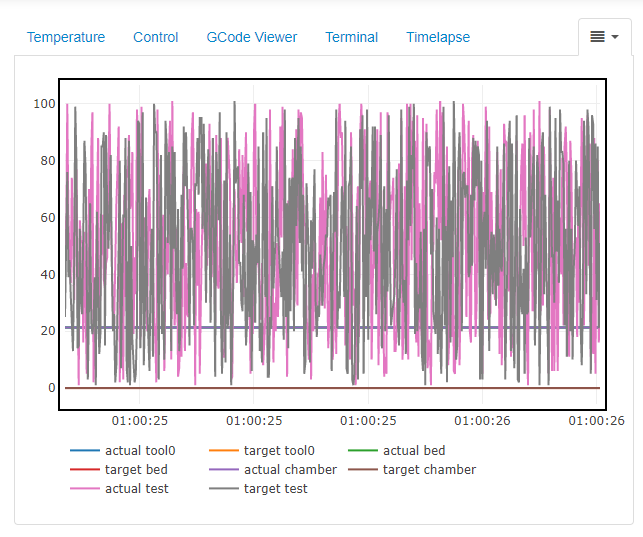
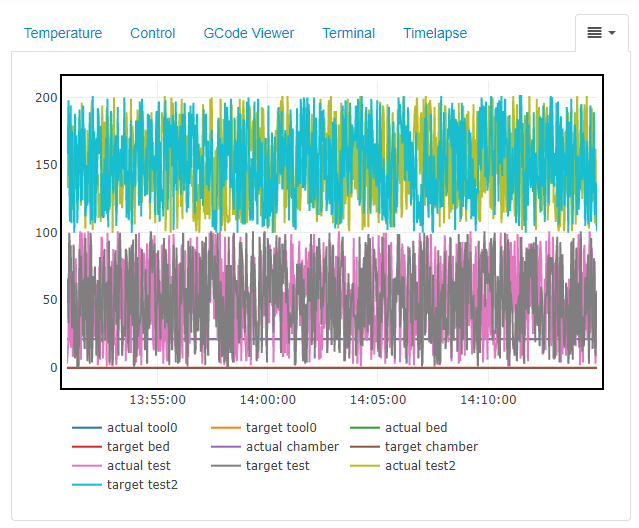
Yeah, when there's lots of random data in a range of 100 steps it gets pretty busy. The cool thing about plotly is that you can go from this...
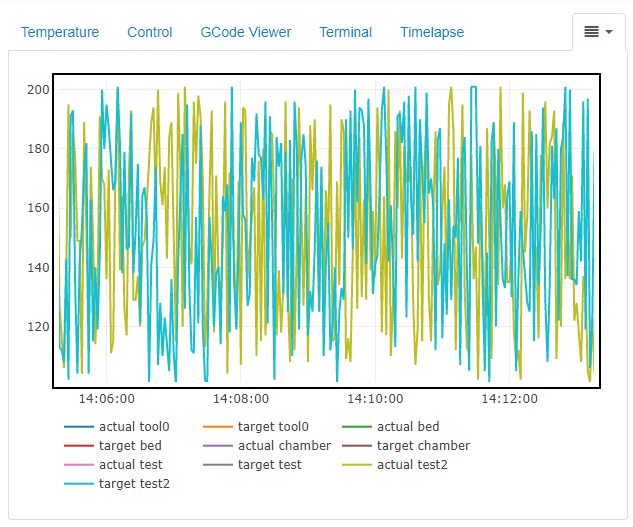
to this...
by dragging a zoom window.
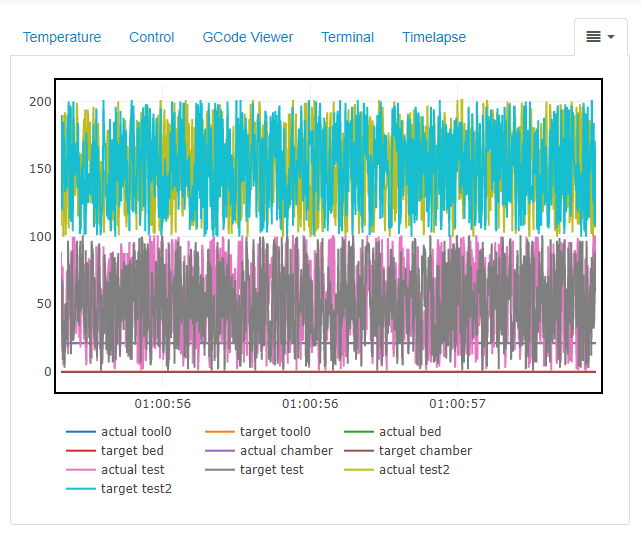
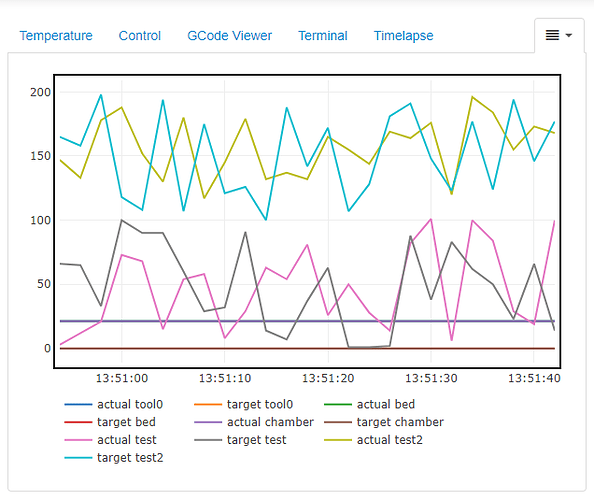
Yeah, the hard part here is that you don't know how many additional temperatures are going to get added. I'm currently using the default plotly assigned colors, which from reading appears to repeat after 10 lines. I looked into methods for retrieving the assigned color of a line so I could add the actual and then convert it's color to a faded version of it (like you're doing up there) using pusher.color(inputcolor).tint(0.5).html() but there's no good way to do that it seems. I could do a color dictionary and do lookups based on name maybe.
The top of one of my Kivy files looks a bit like...
#:set custom_button_background              RGBA('#414241FF')
#:set custom_button_background_disabled     RGBA('#323332FF')
#:set custom_disabled_text_foreground       RGBA('#616361FF')
#:set text_selection_color                  RGBA('#45C01A33')
#:set transparent                           RGBA('#00000000')
#:set white                                 RGBA('#FFFFFFFF')
#:set white_80percent                       RGBA('#FFFFFFCC')
#:set title_color                           RGBA('#AFB3AFFF')
#:set tile_background                       RGBA('#414241FF')
#:set tile_disabled_background              RGBA('#323332FF')
#:set tile_disabled_text_foreground         RGBA('#616361FF')
#:set highlight_green                       RGBA('#33CC11FF')
#:set background_green                      RGBA('#33CC118F')
#:set button_green                          RGBA('#33CC114F')
#:set button_gray                           RGBA('#B3B5BAFF')
#:set prepare_instructions_color            RGBA('#AFB3AFFF')
#:set purple_100percent                     RGBA('#B05DFFFF')
#:set purple_50percent                      RGBA('#B05DFF8F')
#:set purple_25percent                      RGBA('#B05DFF4F')
#:set blue_100percent                       RGBA('#71DEFFFF')
#:set blue_50percent                        RGBA('#71DEFF8F')
#:set blue_25percent                        RGBA('#71DEFF4F')
#:set status_green                          RGBA('#33CC11FF')
And then it's just a macro inserted later.
