Does anyone have any experience in finding memory leaks in javascript/web applications. I'm trying to nail down what could potentially be a memory leak in the TabOrder plugin and have no idea where to even start. Additional information of the issue can be found in the plugin's issue tracker here.
Would greatly appreciate any assistance with this, as what might be causing this could also effect several other of my plugins and I want to make sure I'm not introducing poor performance into the platform.
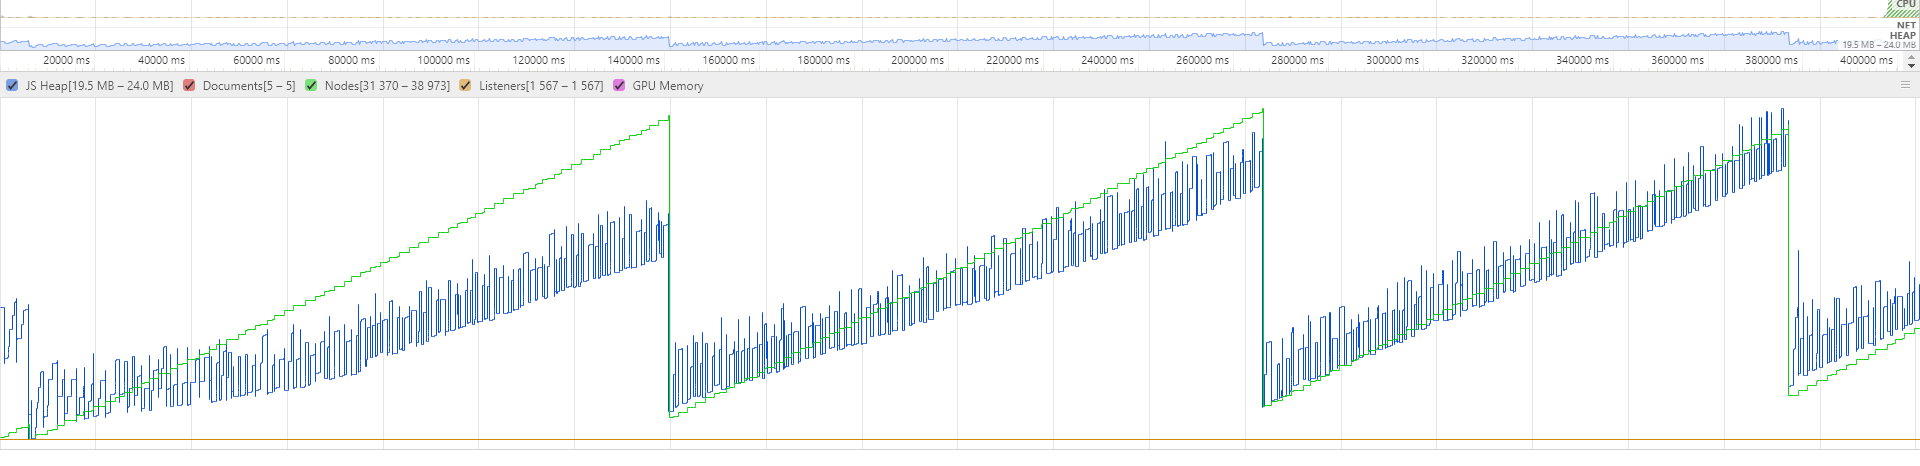
Doing some quick profiling over 400 seconds, this is with all plugins disabled.
git bisect definitely is your friend here in that scenario, at least if it was a specific commit that introduced the issue. Which would also be a result that helps you narrow this down further.
Thanks @kantlivelong and @foosel, I know the two major changes that could have introduced the issue but it's still uncertain that there is an issue based on the latest comment in the issue tracker. I saw the issue locally once but haven't been able to reproduce the large memory growth that's described of going into the GB usage range since that one time, so not sure if there is a specific trigger that causes it or if it's related specifically to this plugin or not. That's why I kept scratching my head.
Thanks @seb for that article link. I'll look into doing the two snapshots and comparing to see what is being added. I was looking into this last night, and the largest items seemed to be internal OctoPrint stuff and nothing specific to my plugin, but it was hard to verify that because so many things get embedded under knockout, which I assume is related to observables.
Yeah, that's the crazy part. OctoPrint core includes that tabdrop library and has for a long time, which made me think it was related to my "patched" version. However, just profiling OctoPrint without any 3rd party plugins enabled it seems there might be a leak if I'm interpreting this object dump correctly.
It might be worth temporarily adding a console log inside there to determine just how often this thing runs and whether it's only during move events or otherwise.
If I'm reading the code correctly it's binding that function to the window.resize event here in the default implementation. My version works the same, but having both of them may be causing a conflict. I'm still not convinced this is a Tab Order plugin issue at this point, because I still have only been able to reproduce once.
I guess what I'm saying is that hooked events in JavaScript are supposed to be told, basically, if I'm authoritative and will handle this myself or if I'm going to add some value and then let the default handler to its thing, too. I don't honestly know what the default state is for this.
It's possible that either or both aren't making this distinction and there's conflict as a result.