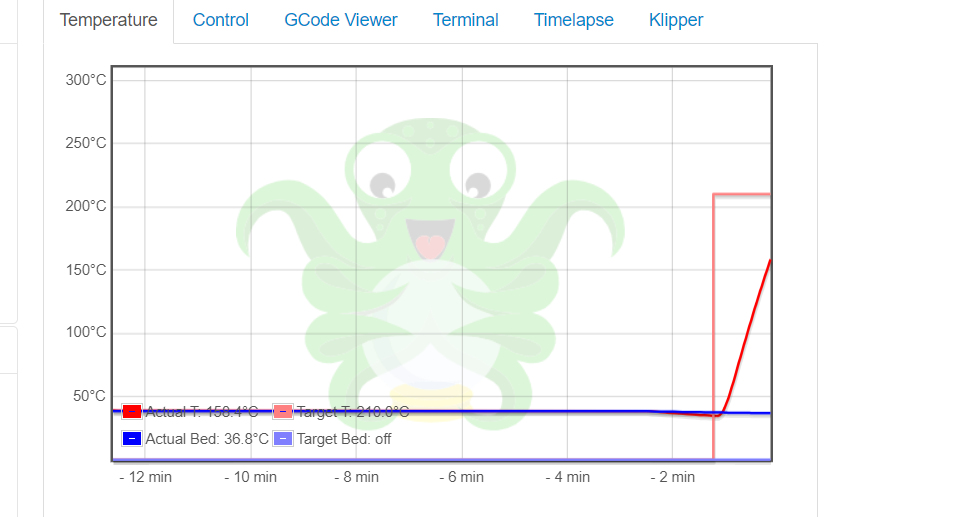
Can you move the temp lines. If you don't use the bed it hides the temp of the extruder
1 Like
Why not instead just set your printer profile correctly?
OctoPrint -> Settings -> Printer Profiles -> your printer -> edit -> Print head & build volume -> Heated bed = unchecked
1 Like
That removes it. I want to MOVE it so it's out the way of the extruder temp
I have to admit that I've never seen this problem myself because my bed is never at 36°C at ambient temperature O_O
The problem is - where to move it? If I move the legend up the upper left then the same issue will arise if the hotend is at temperature. Which is actually why it's where it's at - least risk of interference at normal operation. Putting a more or less opaque background color on the legend also doesn't really help here (I just tried).
Even some funky logic like "temperatures below 100 -> up, above 100 -> down" won't work because if you have the bed off and the extruder on, what should it decide on?
As you can see, simple request, ultra complex problem. For which I think the current position is probably the best one.
2 Likes
Yer, the bed temp doesn't move until 50* so any temp below that would still cover it. maybe move the graph up, Start at 20 .
It wasn't 32 in the house that was after a print but just happened to be the screen shot 
There are people with printers in cold garages which have ambient below 20. Those would probably get angry if their graphs didn't show properly anymore. There are also people with more than one extruder + bed + (in 1.3.11) chamber temperature on there, so that thing can climb up a bit.
The only other option would be to move the legend outside of the graph altogether and that brings a whole rat's tail of adjustments with it which I'm frankly not seeing justified for the rare case of "a line on the graph makes the legend a bit harded to read" 
LOL I can understand that.
I used to see it all the time, I kept the print room at around 35 degrees with a heater, my solution was to just install the navbar temperature plugin and never look at the temp graph legend
The only time mine are at the same place is when I'm not printing anything, at which point it doesn't really matter. Once I turn it on, the lines move
PS. Mine is in a cold basement, sometimes the temp is as low as 10C on a really cold day. That's when those lines come in really handy.
I move the nozzle up about 10CM above the bed, and turn on the bed heater to about 60-70C. When I see the nozzle temp reach about 25C, I know that the inside of the enclosure has warmed up sufficiently to start the print.
I do have a thought tho. Is there any way to add a 3rd line to the graph ? Like if I was to install an enclosure thermistor ?
Or is there already a plugin for that ? There are so many I can't keep track anymore
See this comment - chamber temperature will be included starting with 1.3.11, if configured in the printer profile and supported by the firmware.
1 Like
This seems like a no brainer to me. Just move it to the top and it will never be obscured by the temperature readings. I see that it's hard coded into some javascript function (somewhere). In the below example I changed the CSS "bottom:32px" to "top:12px":
Seriously, ultra complex problem? The logic would be, if temperature is > 250 then use "bottom: 32px" else "top:12px"...
Or, just move the legend outside of the graph...
Every single change has consequences. I explained the challenges with all alternatives so far proposed and in which situations they'd work less well than the current solution. Send a PR if you think you have a solution that works for all possible cases and doesn't break people's existing setups.
When I say "ultra complex problem" I don't mean it's unsolvable or brain surgery, but it's also not a case of "just do X". It's almost never a case of "just do X" and least of all in situations where you are handling dynamic data, and yet I constantly get flooded with "just do X" recommendations that on closer look fall to pieces.
It feels like it's something that could be done with the Themeify plugin, for what it's worth.
I'm not so sure on this one @OutsourcedGuru, because the temp graph is using the flot library and if I remember correctly that text is drawn by the library itself into the canvas, but I might be wrong.
If it bugs people so much maybe they should consider the Tempsgraph plugin or my work in progress PlotyTempGraph plugin which has a toggle for the legend.
In theory, the "sw" here changed to "nw" would move the legend. I'm guessing that this is approximately where it's brought in. All this looks like canvas rendering.
In the Developer's console I'm doing this:
$('.legend table').css({ top: '100px' });
...and it's moving it. But of course, it's being overwritten each timer event. So yeah, Themeify couldn't work for this.
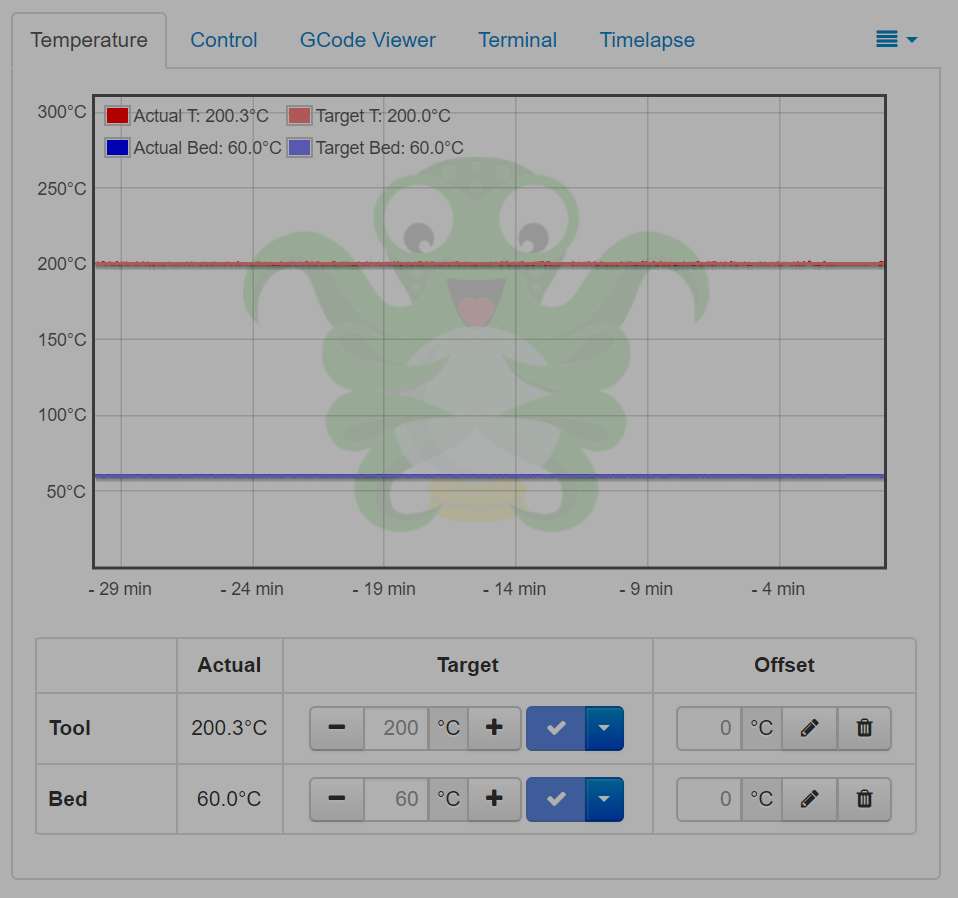
Btw. I moved the legend to "North-East" (upper-rigtht). if needed, you can scale the max y-axis a little bit e.g. to 400 °C. Current factor is 1.1
The change is done here:
octoprint/static/js/app/viewmodels/temperature.js
var options = {
  yaxis: {
    min: 0,
    max: Math.max(Math.max.apply(null, plotInfo.max) * 1.1, 310),
...
  legend: {
    position: "ne",
...
Yes, I know that I need to change this everytime I update OctoPrint.
To be honest, I didn't read everything in detail here or in the mentioned ticket....so I don't see a problem to move the legend everytime over the max-temp, yes graph is then a little bit smaller, so what.
Just my two cents 
1 Like
fyi: I created a small plugin which moves the legend in one of the corners:
4 Likes