With your permission, I will outline the deficiencies I have observed in the plugin's graphical design when working with a web browser. From an analytics standpoint, I believe the plugin works flawlessly.
Here are the issues:
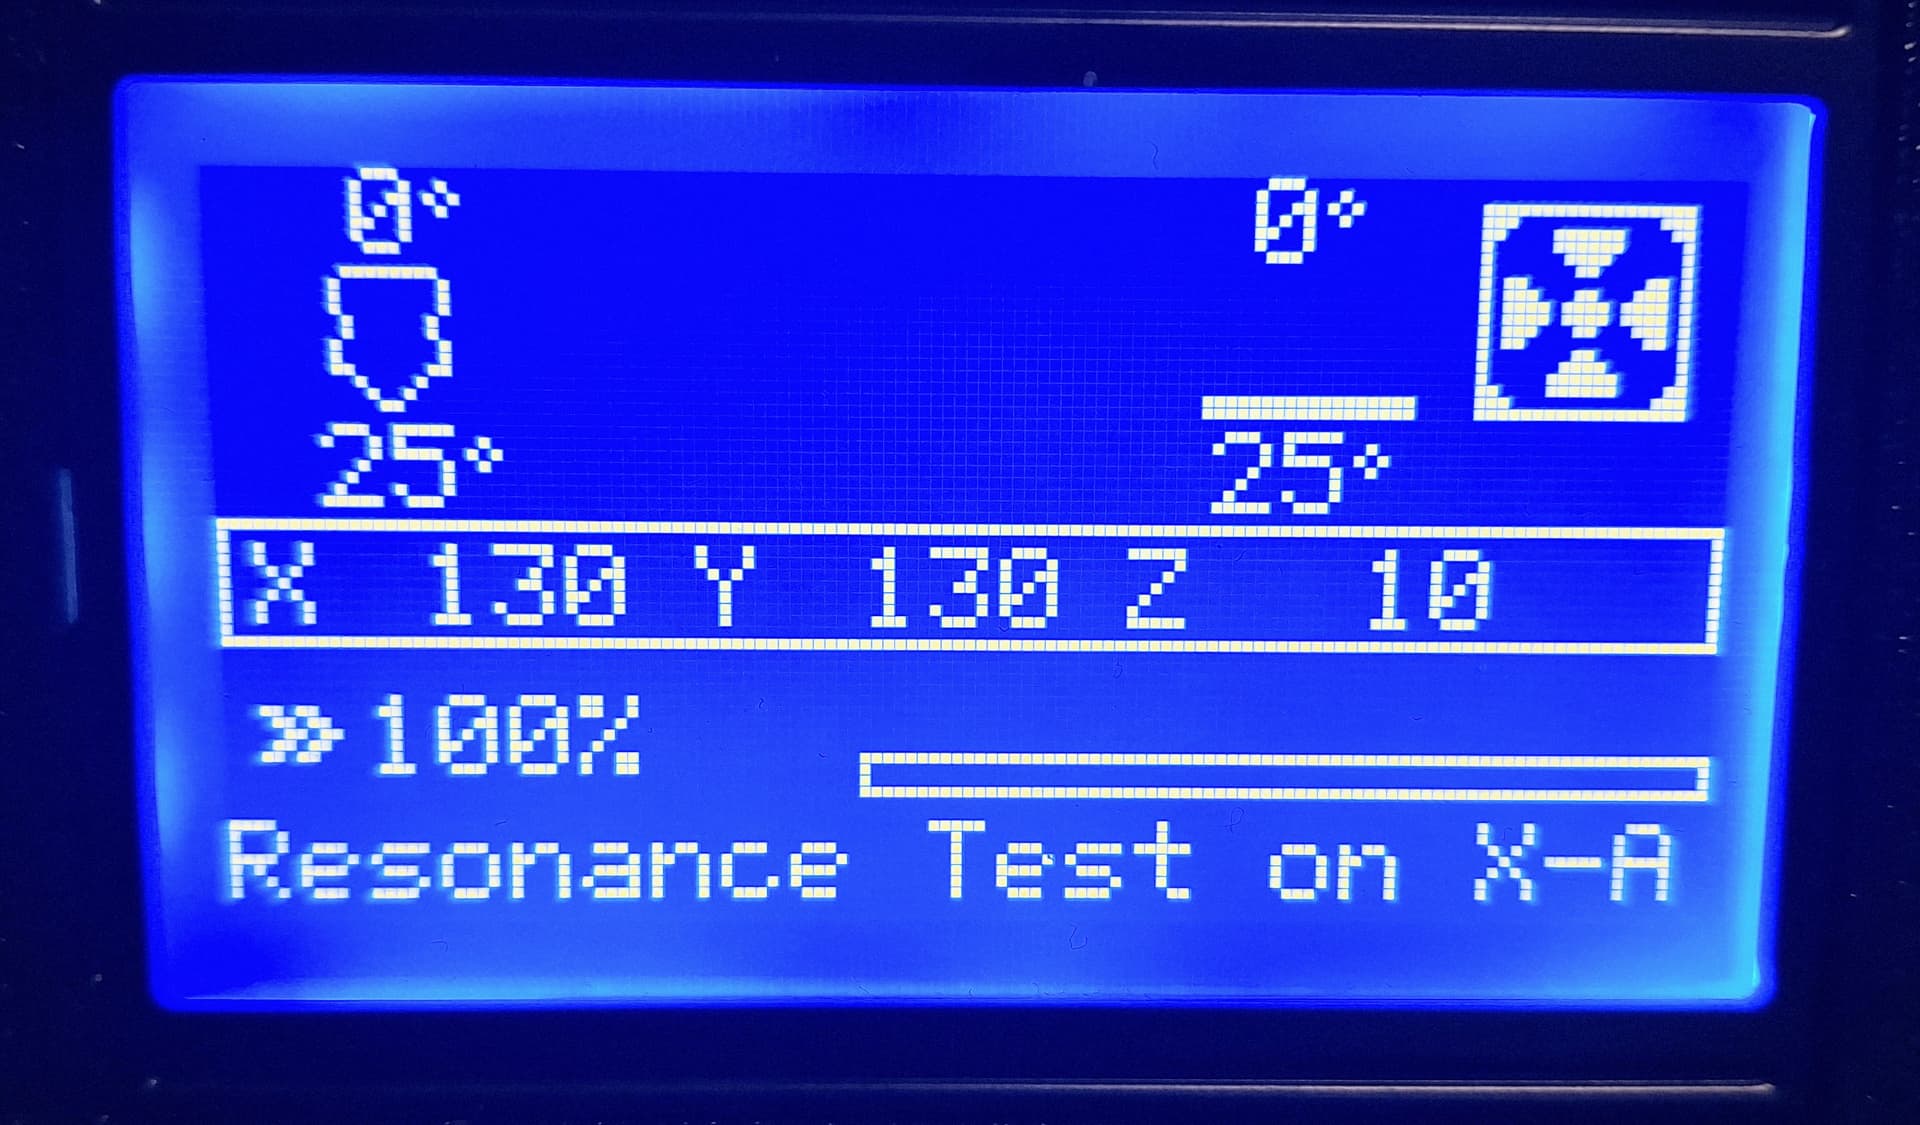
On the 128x64 LCD screens (which many printers are equipped with), the process status message is not fully displayed. These screens have a horizontal limit of 21 characters.
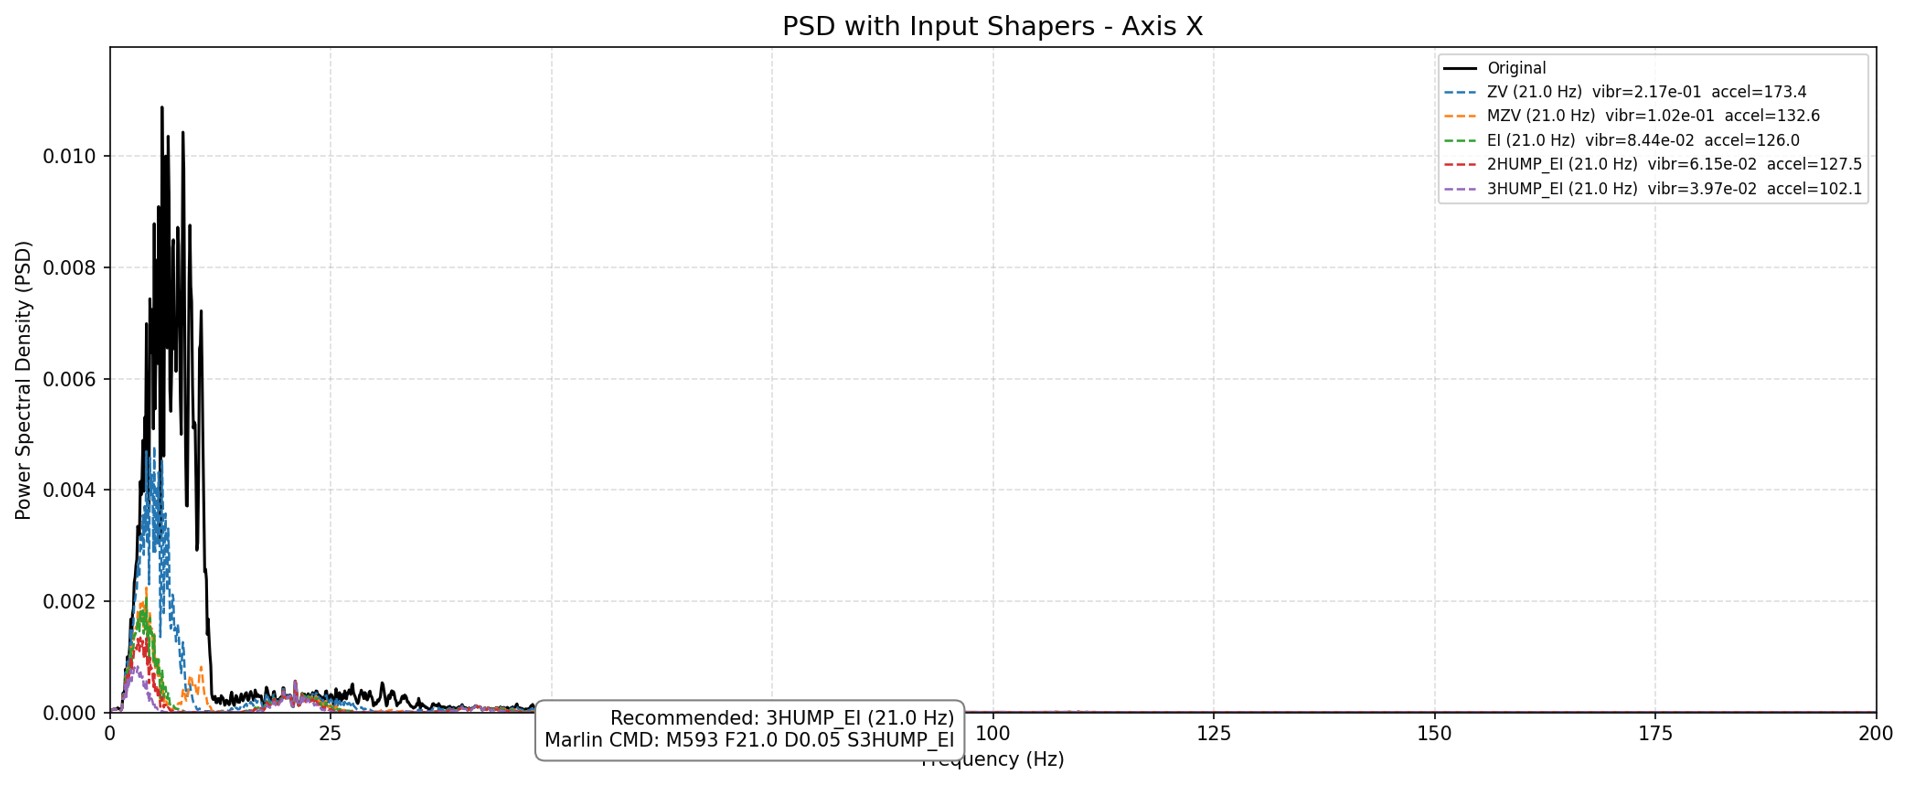
Changing the final frequency does not affect the resulting graph. The final frequency on the graph is always 200 Hz, which is inconvenient when only the relevant portion of the data is needed.
After clicking the Sensor Values button and navigating away from the OctoPrint page and then back, the plugin displays hundreds of sensor values. It would be helpful to limit these values to about 10 lines.
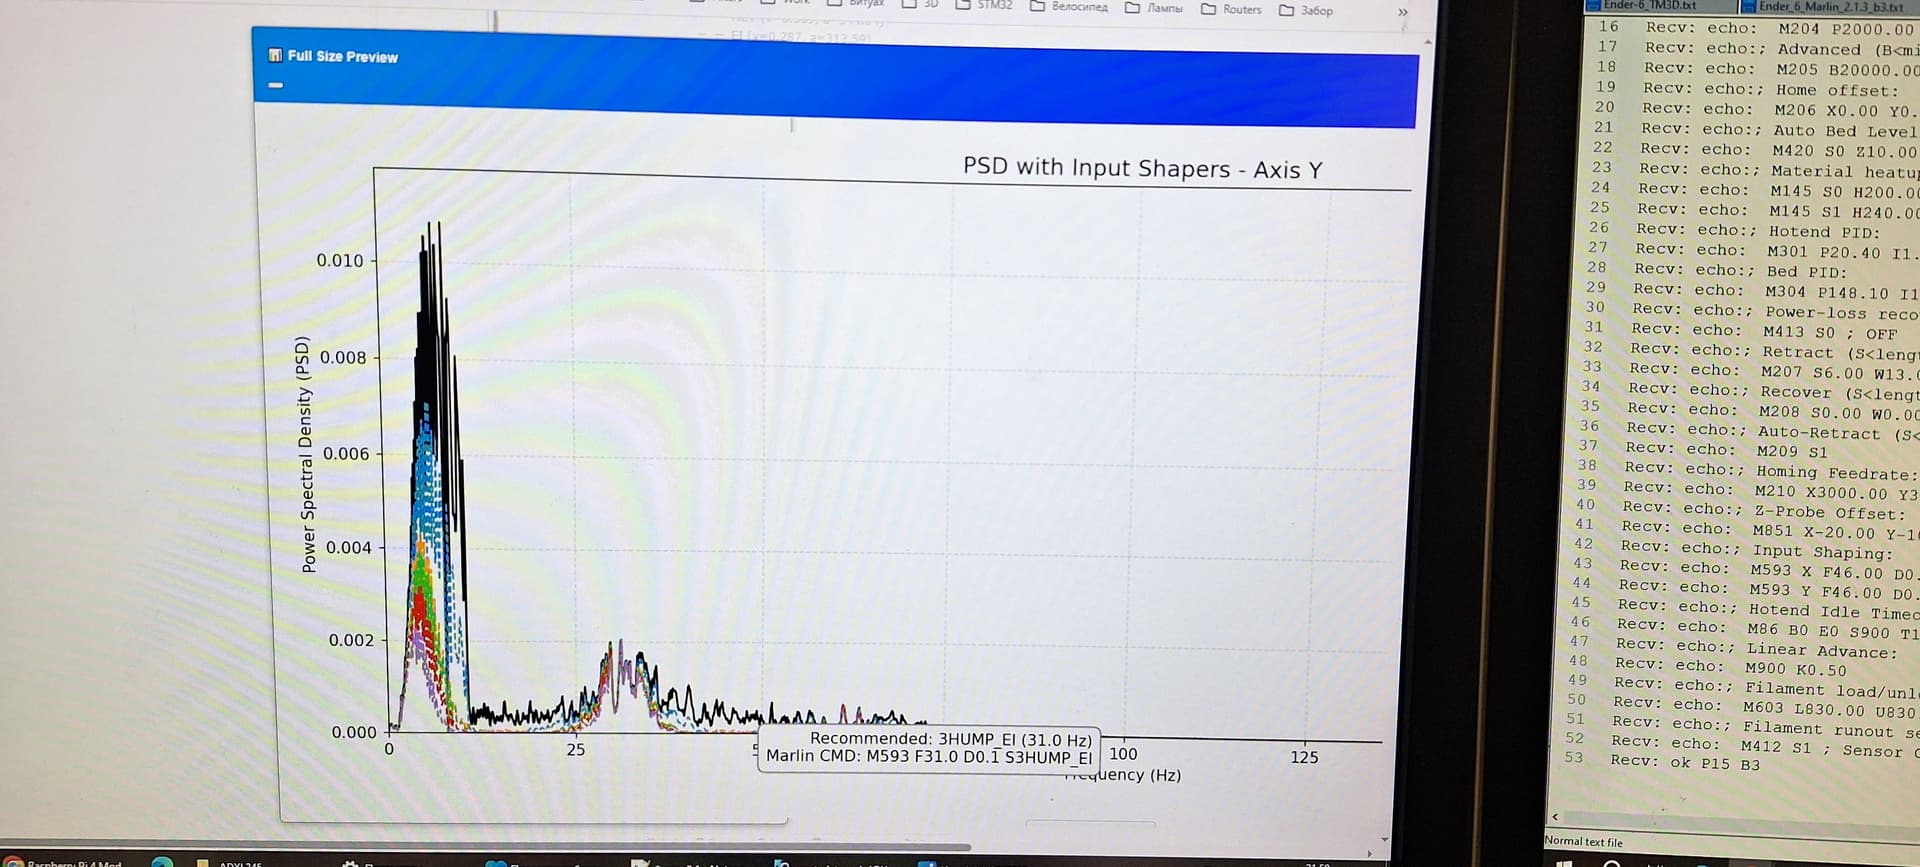
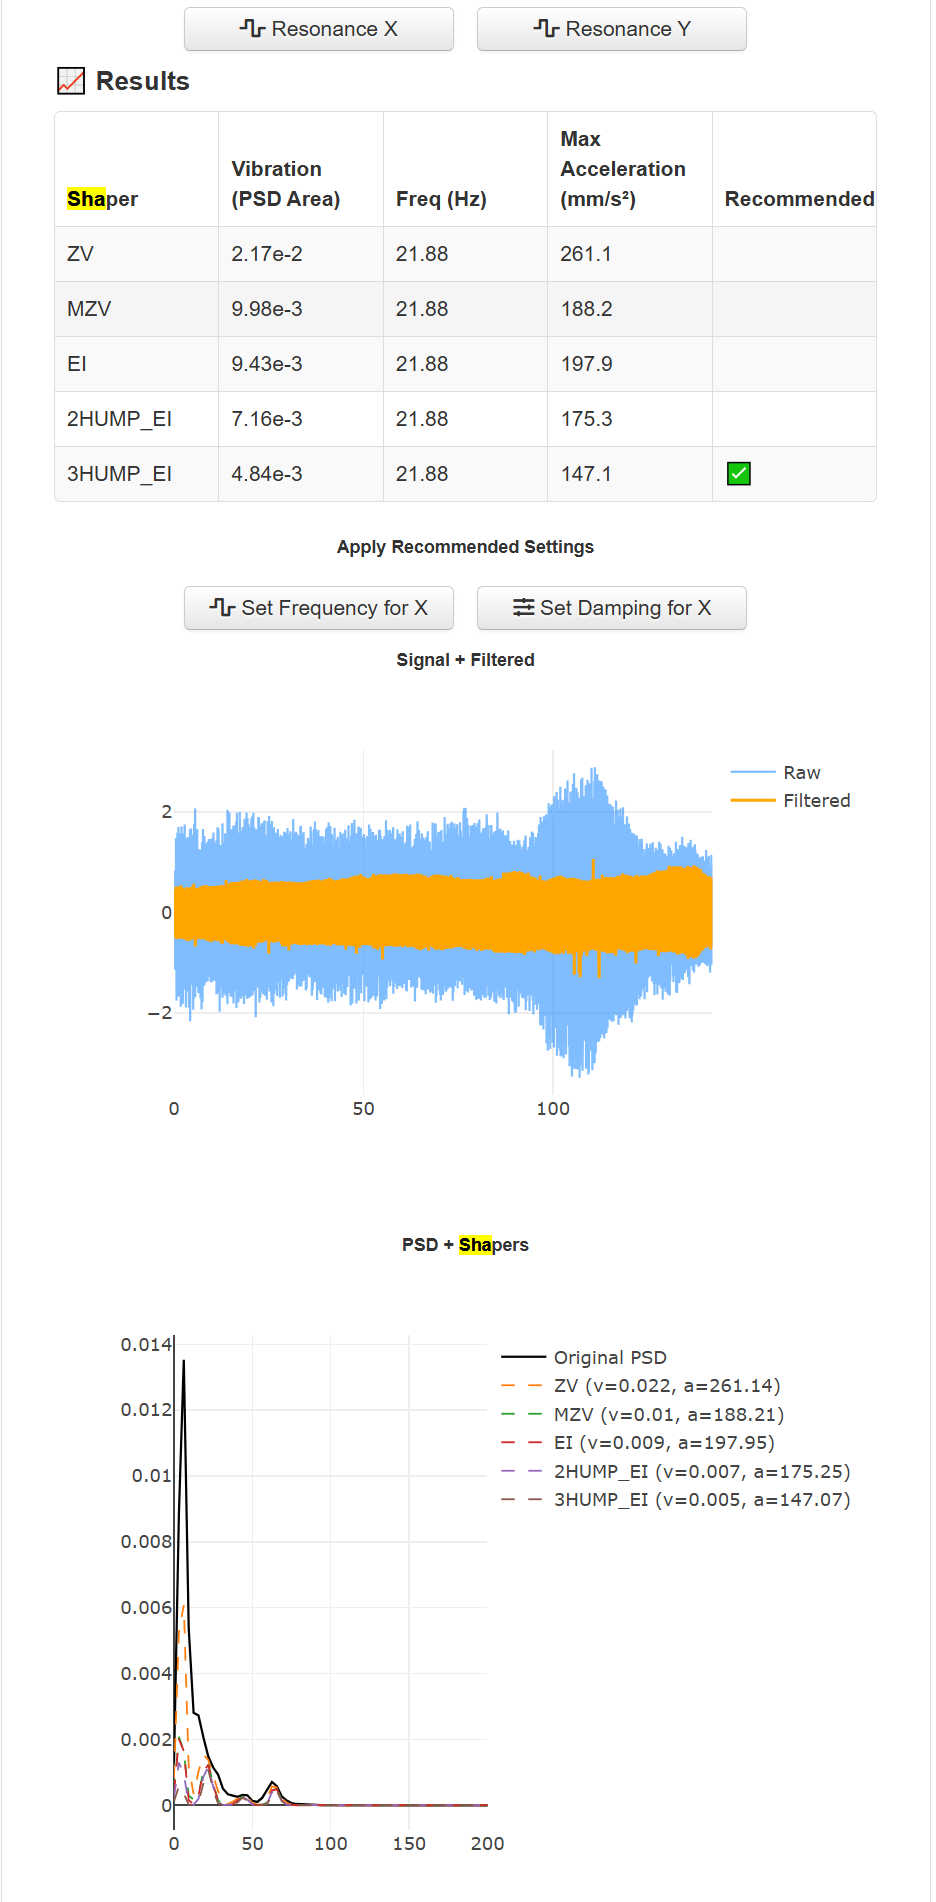
When opening the graph in zoom mode, it appears clipped or cut off. The missing section is not displayed even on a secondary monitor. Furthermore, the download button is outside the frame. The informational text labels overlap the scale.
Thanks for the feedback, the Plugin still in Release Candidate stage or Beta version if you prefer, so yes there are a lot of things to fix and improve.
I'm taking note of everything what you found in your testing, thanks for reporting. Will be great as @jneilliii pointed to open issues in the repo so I can track it better. In the meantime:
Good to know I'm using a different LCD, so I will check to shorten the message.
Indeed, must fix that.
Yes, initially the UI of that feature was developed fo the SPI sensor which was configured to show 10 lines, then people asked to support USB sensors and forgot to change that UI behaviour.
Noted.
Let me check if Plotly can put those somewhere else.
I've been trapped trying to fix the custom firmware of my Printer so all the above improvements will take a little bit more to be fixed, there are things that must be worked on the Shaping plugin too like giving the acceleration recommendation so yeah, I need time to fix it.
Thanks again for taking time on reporting the issues.
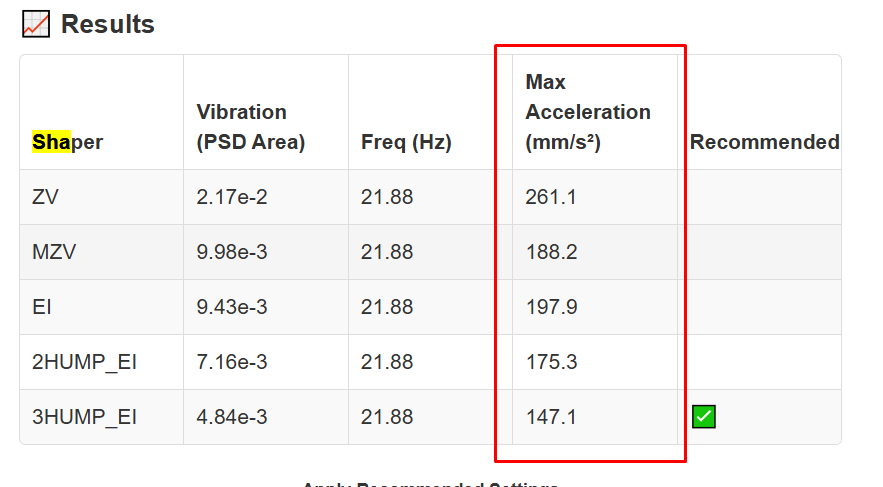
We are not calculating (yet) the acceleration values. The acceleration that you see is the effort made by the test but not the suggested to edit in the printer's values.
For now we use the acceleration set already in the printer's settings.
The calculation of the suggested acceleration is still a work in progress. That's why the header doesnt says Recommended Acceleration and there is no button in the UI to set it automatically because is not in place.
Regarding the Recommended shaper the algorithm chose it based on your results is not hardcoded, in your graph I see 3 peaks.
The acceleration that you see is the effort made by the test but not the suggested to edit in the printer's values.
Don’t get me wrong, but if the application clearly does nothing, that’s much better than showing numbers that have no relation to reality.
That's why the header doesnt says Recommended Acceleration and there is no button in the UI to set it automatically because is not in place.
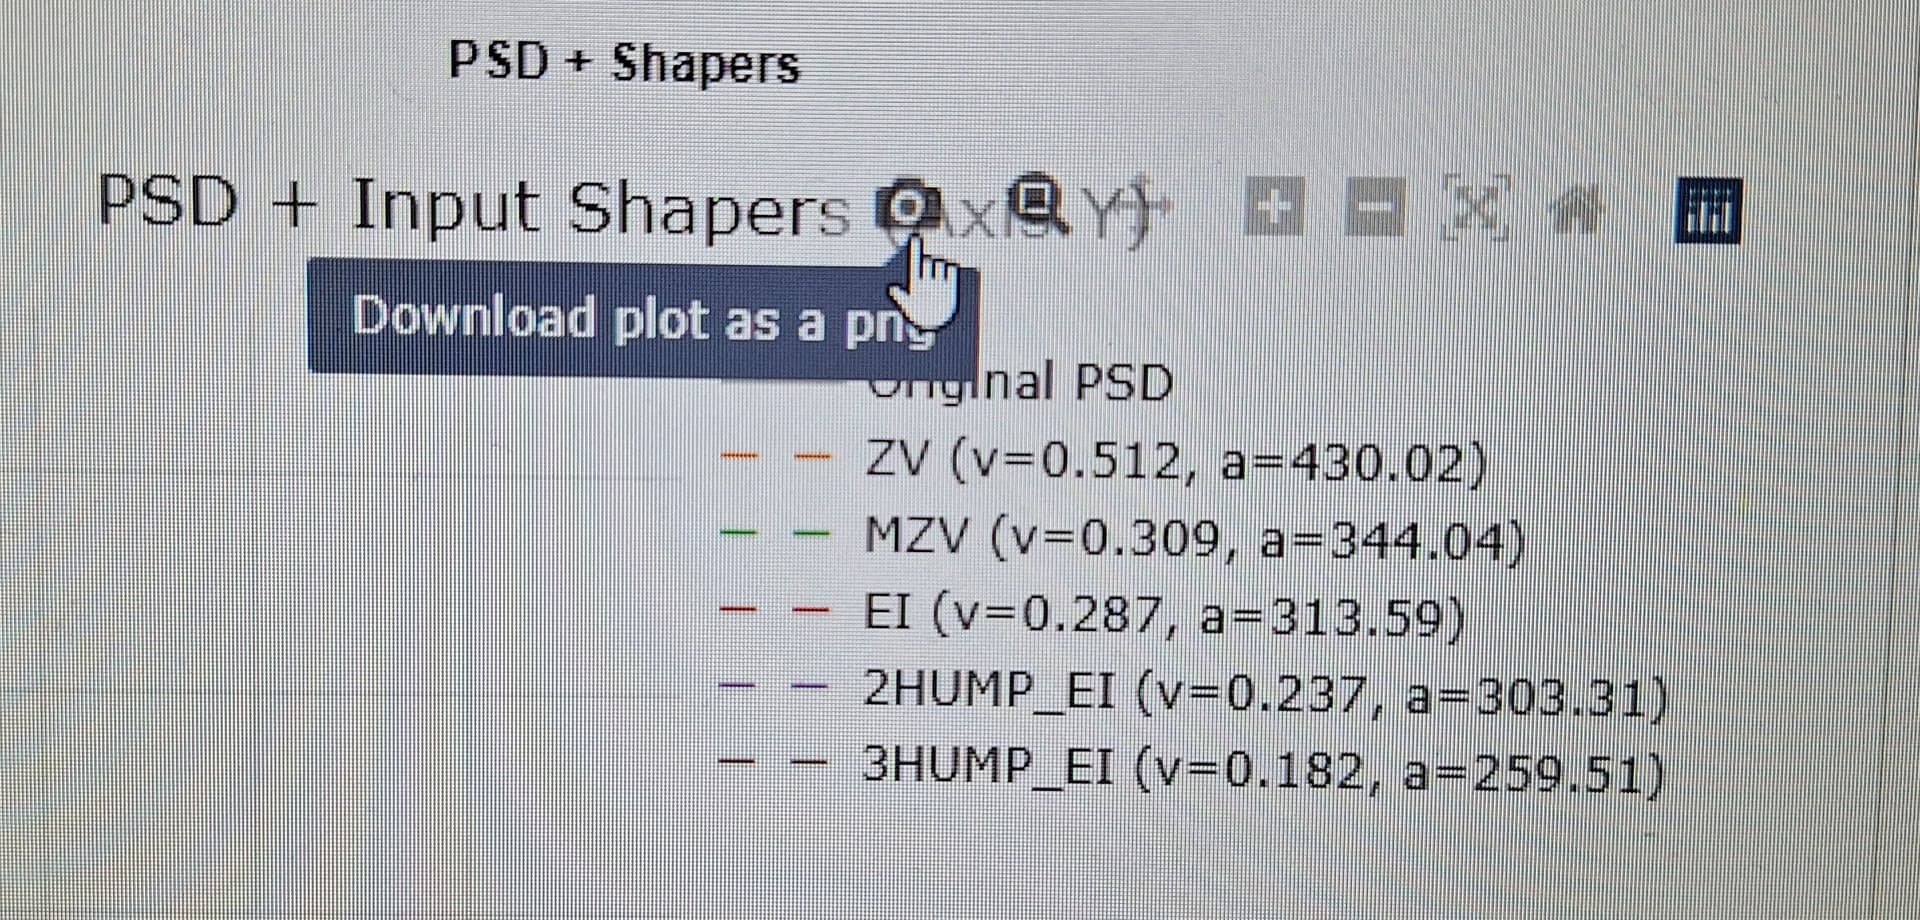
That’s still poor design, because even though it doesn’t say Recommended, it does say Max Acceleration and even has a "Recommended" checkbox next to it!
I fully understand that this is volunteer work and no one is getting paid for it — so once again, thank you for creating such a cool tool.
Still, please take this as valuable feedback. Especially at this early stage of development, new users may be curious to try the tool, and if they leave because of confusing UI, it may be difficult to bring them back later.
I hear you, just keep in mind the plugin is still in a release candidate stage. About the Table I needed to see how it is presented in the UI so I filled the column with the acceleration effort value in the mean time. Later I'm planning to make the calculation and put ir there.
Tha table is kind of a mimic of the Klipper results:
$ ~/klipper/scripts/calibrate_shaper.py /tmp/resonances_x_*.csv -o /tmp/shaper_calibrate_x.png
Processing resonances from /tmp/resonances_x_20251129_132623.csv
Fitted shaper 'zv' frequency = 56.0 Hz (vibrations = 15.8%, smoothing ~= 0.056)
To avoid too much smoothing with 'zv', suggested max_accel <= 12200 mm/sec^2
Fitted shaper 'mzv' frequency = 36.6 Hz (vibrations = 1.7%, smoothing ~= 0.152)
To avoid too much smoothing with 'mzv', suggested max_accel <= 3900 mm/sec^2
Fitted shaper 'ei' frequency = 49.4 Hz (vibrations = 0.2%, smoothing ~= 0.135)
To avoid too much smoothing with 'ei', suggested max_accel <= 4400 mm/sec^2
Fitted shaper '2hump_ei' frequency = 88.0 Hz (vibrations = 0.0%, smoothing ~= 0.073)
To avoid too much smoothing with '2hump_ei', suggested max_accel <= 8200 mm/sec^2
Fitted shaper '3hump_ei' frequency = 108.6 Hz (vibrations = 0.0%, smoothing ~= 0.075)
To avoid too much smoothing with '3hump_ei', suggested max_accel <= 8000 mm/sec^2
Recommended shaper is 2hump_ei @ 88.0 Hz
Thats why the recommendation is there too, although for many Marlin version only ZV is valid, but still we wanted to show the different analysis.
We (Isellens & I) were working hard to bring a community plugin that allows people to almost plug & play with the accelerometers, a big difference with Klipper where you need to touch config files and go into the Linux Shell, our plugin is almost all controlled from the UI. Yes, it need some tweaks but as you noticed we work on this for free and in our free time so PRs are also welcome to improve it.
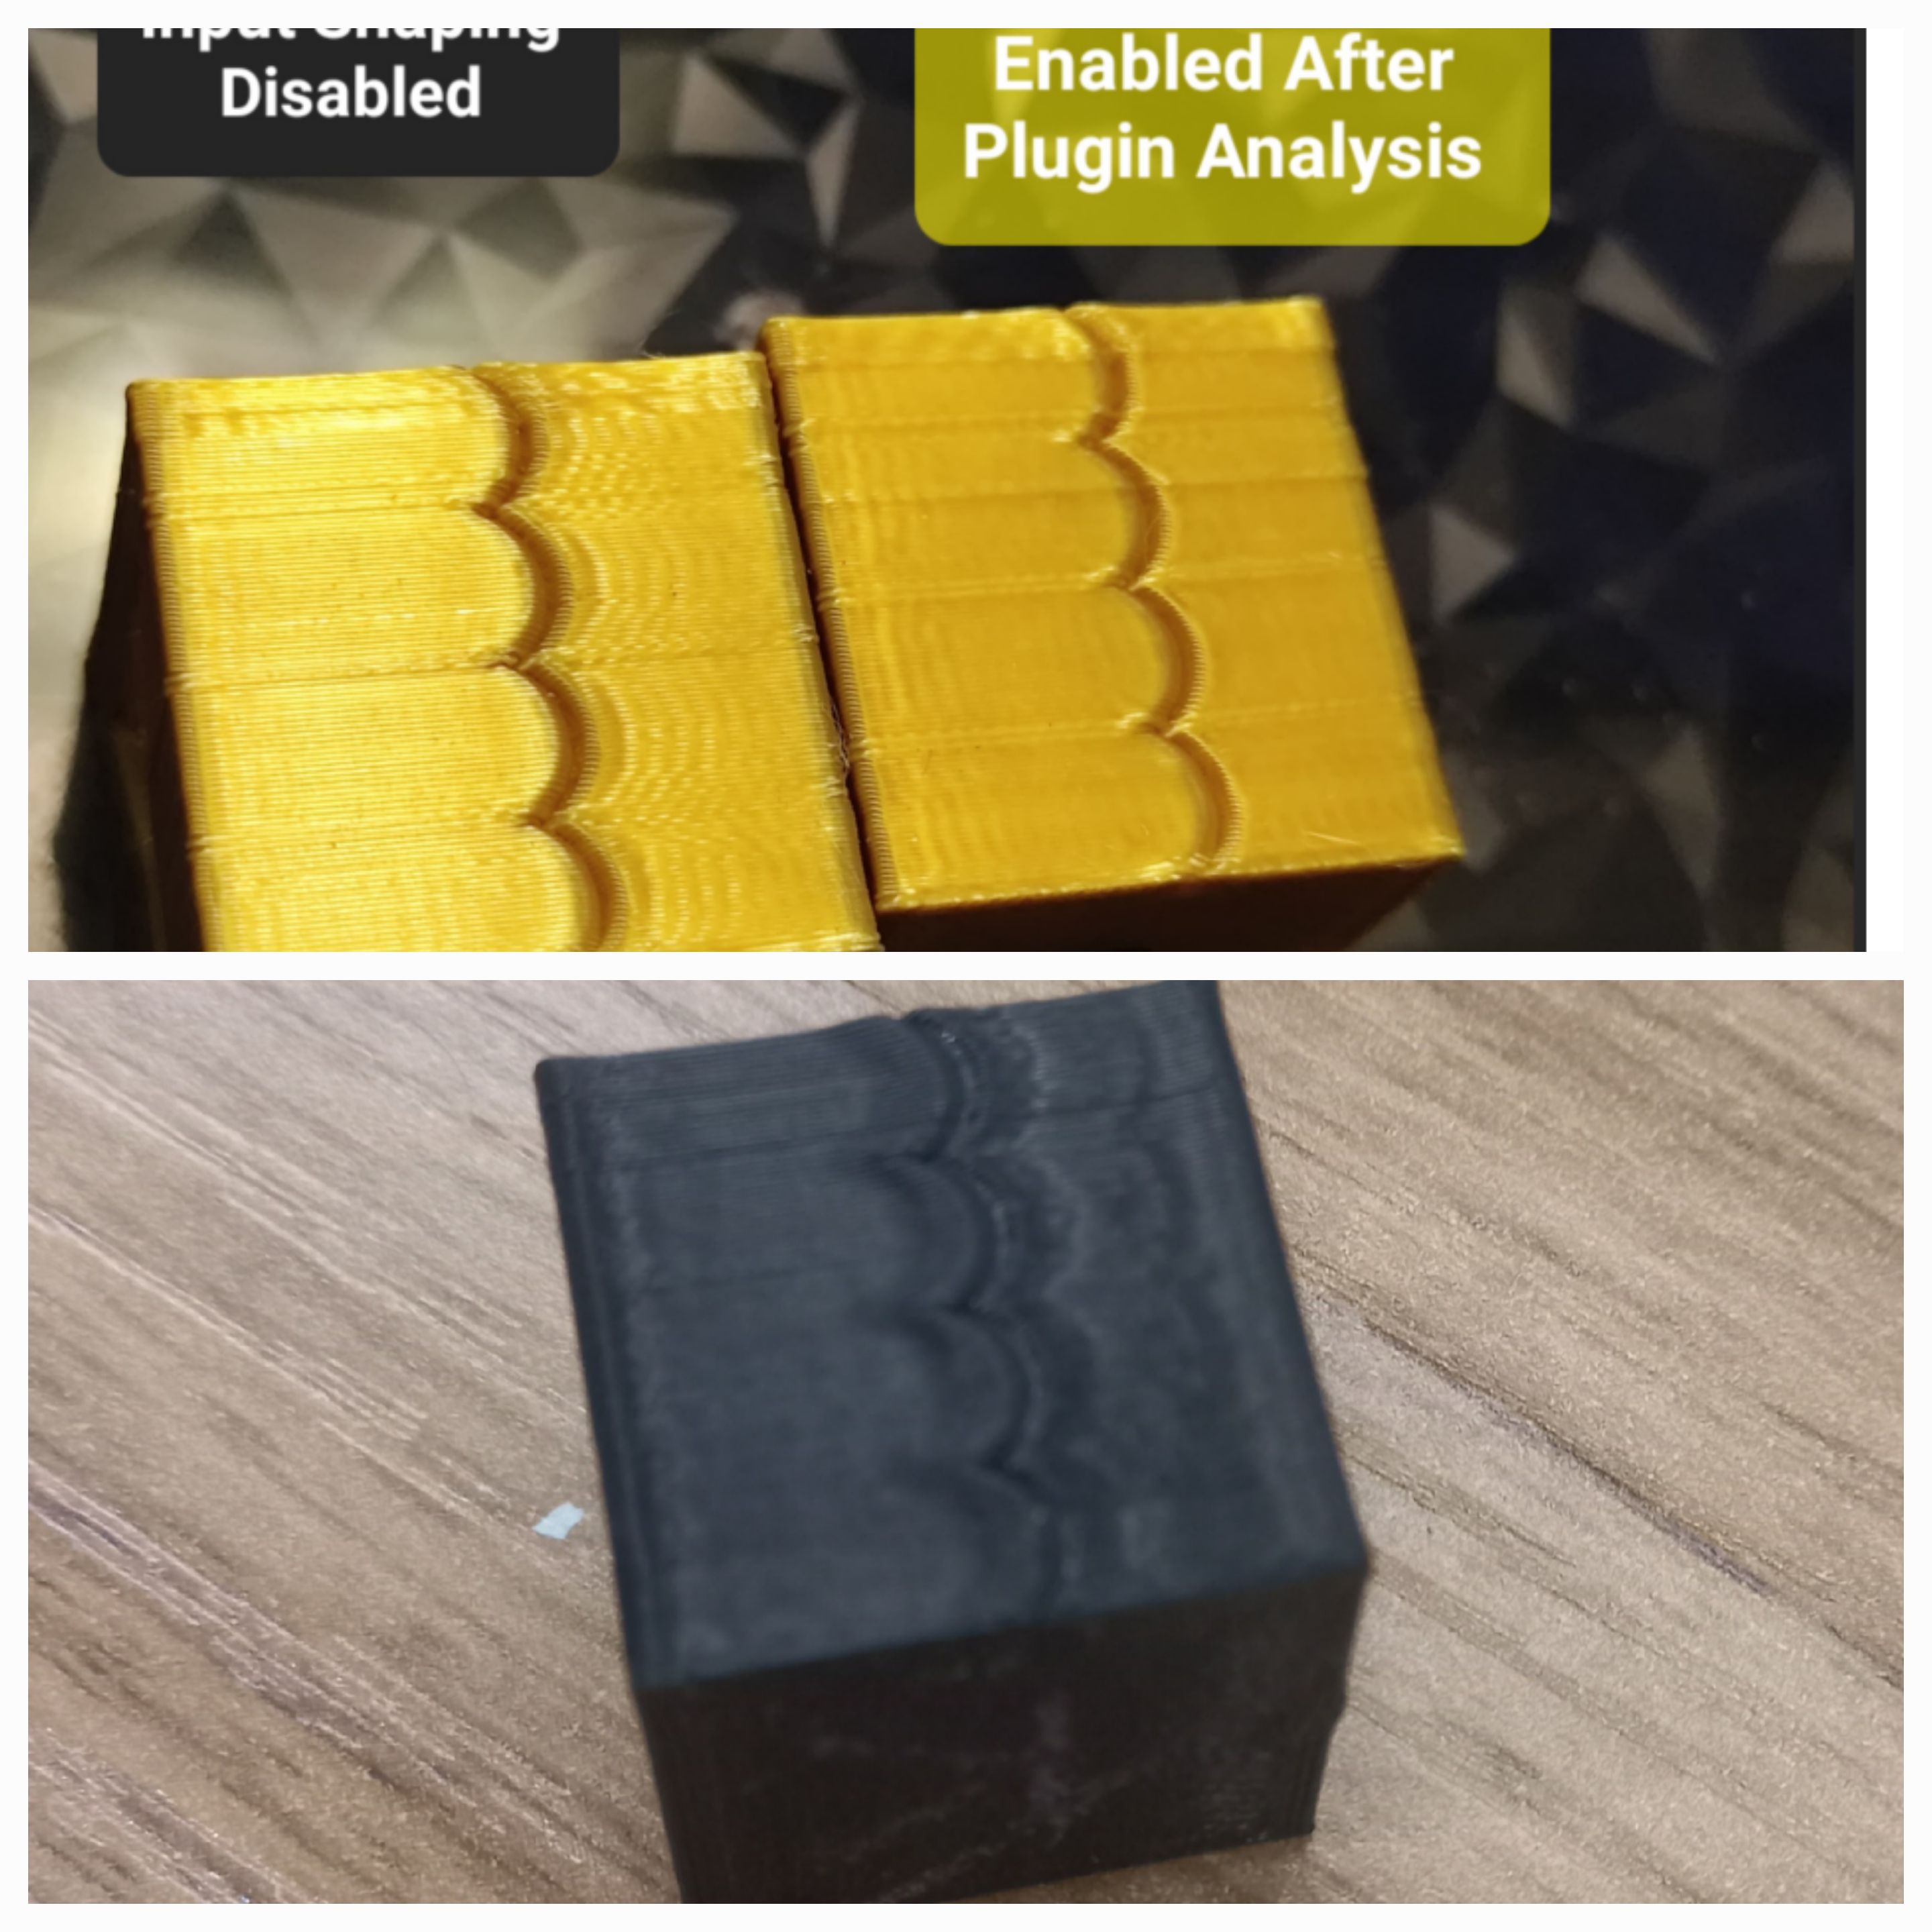
The Plugin works, here you can see in the black cube the Input Shaping enabled on a Klipper instance running the same E3V3SE and the Golden Cube on the right has the Input Shaping enabled on the same E3V3SE running Marlin: