PlotlyTempGraph additional value visible

Hello,

for an improved cooling of my Ultimaker2+ I use a PC water-cooling system.
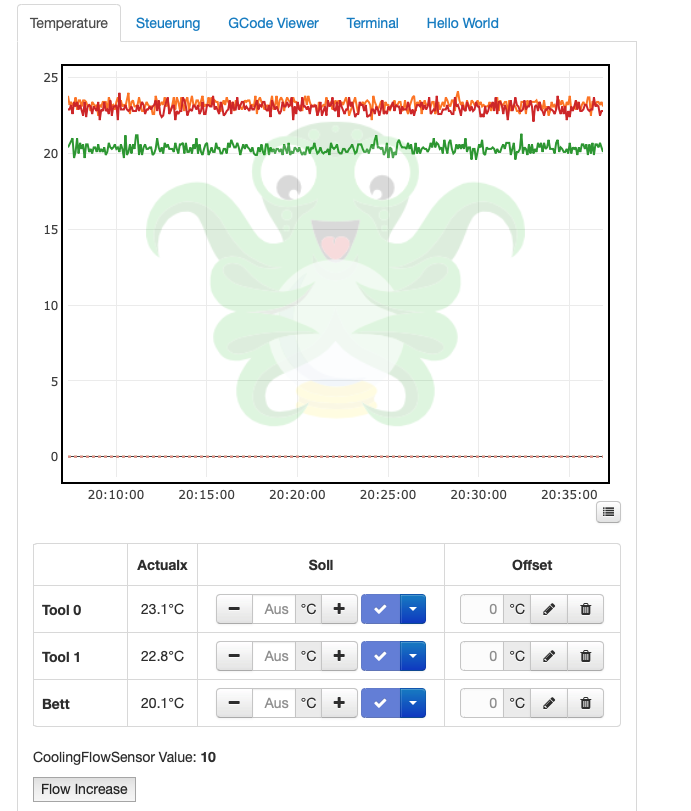
Now I would make the cooling fluid flow visible in the Octopi temperature graph.
Here I use the PlotlyTempGraph PlugIn. I'm able to make an additional value visible in the temperature graph and after the restart the value will be shown, but I'm not able to update the value on a regular base.
To generate a change of the value, I added also a button to increment the value.

Change in plotlytempgraph_tab.jinja2:

    <div class="control-group">
	<p> CoolingFlowSensor Value: <strong data-bind="text: getCoolFlowSensor "></strong></p>
	<button data-bind"click: flowincrease"> Flow Increase</button>
    </div>

Change in plotlytempgraph.js

		//Cooling Flow Sensor

		self.getCoolFlowSensor = ko.observable(coolflowsensorvalue);

		self.flowincrease = function() {
			var currentflow = coolflowsensorvalue +1;
            coolflowsensorvalue = currentflow;
			self.getCoolFlowSensor = ko.observable(coolflowsensorvalue);
		}

The start value is 10, so that is the reason, why '10' is shown.

Could some one help me here to get the right implementation as I'm not familiar with Jinja2 and json programming.

Thank you for your support.

Regards

Ralf

You might need to create your own plugin, that can send data to the temperatures received hook. Here's an example of a single file, you need to inject your additional data here:

You can then upload the file to OctoPrint's plugin manager.

1 Like

Yeah, you don't need to modify my plugin, but add an additional plugin to utilize it's ability to graph the additional data. The example above is showing fan speed based on retrieved gcode responses. The below example is just a simple random data being injected into the temperature graph.

Hello,
thank you for your feedbacks. Now I understand the mechanism and will develop my plugin and parse the data into the temperature hock.

Regards

Ralf

1 Like