Nearly 0 python knowledge, but it is working so far.
In the near future, I will publish a single and a multiprinter grafana dashboard.
Questions towards the community:
what would you like to see in a single/multiprinter grafana dashboard?
Question for other plugin/octoprint devs:
The "required" part configured ok in the setup.py?
Is there any easy way to test a newly written and committed plugin (like pop up a container click to there do this, check that, etc.)? If not shouldn't we write it into the distribution doc?
can somebody point me towards plugins/codesnippets/functions where the eventHandler used? (I watched lot of plugins code, but either they are too simple or too large )
I will try to add it to the main repository after some more metrics implemented (maybe tomorrow).
Hi @tg44,
most of your questions I didn't understand, but I will try to answer:
Unclear: If you have python package dependencies the plugin_requires section is the correct way to do (you already use prometheus_client)
Unclear: Do you mean a wizardbased plugin-tutorial after installing a new plugin to show/guide the user all features of the newly installed plugin?
Like jneilliii mentioned using the eventhandler is easy:
-- include octoprint.plugin.EventHandlerPlugin in your class
-- implement the def on_event(self, event, payload): method
Now, I have some questions
What is the goal of your plugin? From my point of view, you want to provide a Prometheus endpoint so that the Prometheus-Server can pull OctoPrint Informations on a regular timeframe, right?
I think there are some drawbacks with this approach (please correct me if I am wrong):
You need to define the data with the ui-representation in the OctoPrint-Plugin like Gauge or Counter
Also if the octoprint-data is not changed you have always network traffic for the "pulling" and probably the "not changed data-event" is stored in the prometheus database
I am asking, because I am also looking for an option to visualize historical data. My goal is to use https://grafana.com/ but I need a storage solution for that.
The OctoPrint-InfluxDB plugin looks promising, maybe a more generic/api approach, so that other plugin-developers could reuse the connection and can send data to that storage.
(the influx-db and the grafana-server should be installed on a separate raspi)
I think developing individual ui-diagramms for special cases like print-history or temp-graphs takes a lot of effort. Also, each user wants to see other informations in such a diagram.
Thats the reason why I don't started implementing a "print-history-diagram' for my plugin
Other developers like @Stefan_Cohen also asking for a timeseries database solution...maybe we can start kind of concept-phase of what functionalities should be in the "timeseries database connector".
In the meantime I solved a lot of stuff I will do a push probably today, but I get a new hw and try to make it work first
I will try the install process in a live setup, I think you answered my main concern.
I meant something like a test framework for plugin devs. I created my plugin, fine, it is working on my machine, fine. How hard it is to try out with a fresh setup? I have no idea. (I have better idea bcs I started to go after the dockerized solutions, and found some promising images.) It would be nice to have a small writeup with "what to do steps" if sb with close to zero python ecosystem knowledge, but basic ops knowledge can follow to make sure the developed plugin will work as-is on other machines too. (But probably this is only my insecureness with the lang end ecosystem, and it's not a problem for others.)
solved, but thx
I definitely want to use grafana. I don't think that we need to add more functionality to the webui. We have good tools and those scales better than reimplementing them again and again in every project.
There is a huge debate between pull and push data consumption. Both have pros and cons. I think in general the pull method has better "real time" performance (you don't need to do the modification/send when things change, you only need to inc/dec/set a variable). Also, most of the "problems" you mentioned are already handled. Prometheus is starting to be the de-facto monitoring solution in the docker/k8s world, I had no problem with it so far.
I'm not pleased with the concept of influx as a monitoring solution, its a kinda good timeseries db, but you need to write quite a lot machinery if you want to send/get/aggregate data (compared to prometheus, where the whole thing is handled by the server). Also the clients need to know who is consuming the data, they need to handle connection errors, etc. (Compared with prom. where you open a single endpoint and you don't need to know if it is consumed by one or ten nodes with minute or in hour intervals, the only need that you need to do is generating a text output for every request.)
Also the duplicated work is not really much I think, I wrote this from the ground (without knowing python but with experience with a bunch of other programming languages) in about 8-12hr (which contains the whole install and "I have no idea what I'm doing" phase with documentation reading, and googleing "how to transform float to string in python"), I can live with it if nobody else thinks that its useful
tl;dr: I think I have a close to good output with a lot of new metrics (not commited yet); I will work towards to add my local code, and some infra code to the repo, and test how its actually works with a prom/graf setup (and later on, start a grafana dashboard)
It's actually working! I uploaded my latest code, added example compose stack for testing and easier bootstraping. I also started a print, and it is geting the data as it should be! The next big thing will be the dashboards! I'll publish this version to the main plugin repo.
(Also I bought a "mini server" for octoprint, and its working much better than the orangepis (ok, it has almost 10x the hw but still).)
Prometheus is an open-source systems monitoring and alerting toolkit originally built at SoundCloud. Since its inception in 2012, many companies and organizations have adopted Prometheus, and the project has a very active developer and user community. It is now a standalone open source project and maintained independently of any company. To emphasize this, and to clarify the project's governance structure, Prometheus joined the Cloud Native Computing Foundation in 2016 as the second hosted project, after Kubernetes.
Yapp, I included links to the doc. Also we are the Jobs/exporters in this image.
So this integration can open up not just graph visualisations (grafana), but also alerting, easily. With service discovery and some hard work this can help a lot to multiprinter setups.
I've personally done some work with the opc-ua specification for device availability/capabilities. It's more on the machine- and job-management side of things.
this week I have a 2x6h train ride...much time to checkout your docker images
I will also try to implement some kind of metric-event-listener in your plugin, so that other plugins could send events with metric-data and your plugin grabs that data, wraps it into a metric-types like gauge, counter, etc. so that the prometheus-server could read it.
I have been running a grafana/influxdb container in my homelab for about four years now and I really like it. I use it daily to monitor servers, services and network equipment. I feed influxdb with data using telegraf and a plethora of homegrown scripts. I haven't played with Prometheus but it seems very similar to Influx.
I've started working on a graphing replacement for temperatures that will also allow for other plugins to submit to and have other data visualized via plotly. I haven't yet got to the second part of opening it up to other plugins, but I do have the temperatures graphing working already.
Of course, this is only handling realtime data while the ui is open and not storing the data for analysis.
Yapp, as I said there are pros and cons for both. If you played with influx a lot, and has your scripts influx is nice. But I more like the prometheus infra, where I don't need any homegrown scripts, or connect my app to a db, or do anything by hand. If I start a mysql/pgsql/rabbitmq/elastic-search/etc. almost a no-brainer to get them under a prometheus server.
This I think is better for single-node installs. But for multi-node and portability grafana is better in my opinion. But if you already have some code with a metric-stream that would be helpful I think.
I didn't find this. I checked the community forum, and the plugin repo with prometheus, grafana, graph, and there was no relevant conversation. Also as I checked this repo, it is really not what I think is useful. For ex. as the head moves you update the x,y,z coordinates, but the metric-scraper will only ask you for `/15/30 secs. What is the information in the x,y coordinates in every 30 sec? Also if you have retraction and z-hop the e and z means nothing too.
They also start up a new web-server on a new port which is at least questionable. (I think this could be a good and a bad idea too, in a dockerised env definitely bad, in hosted env its a meh...)
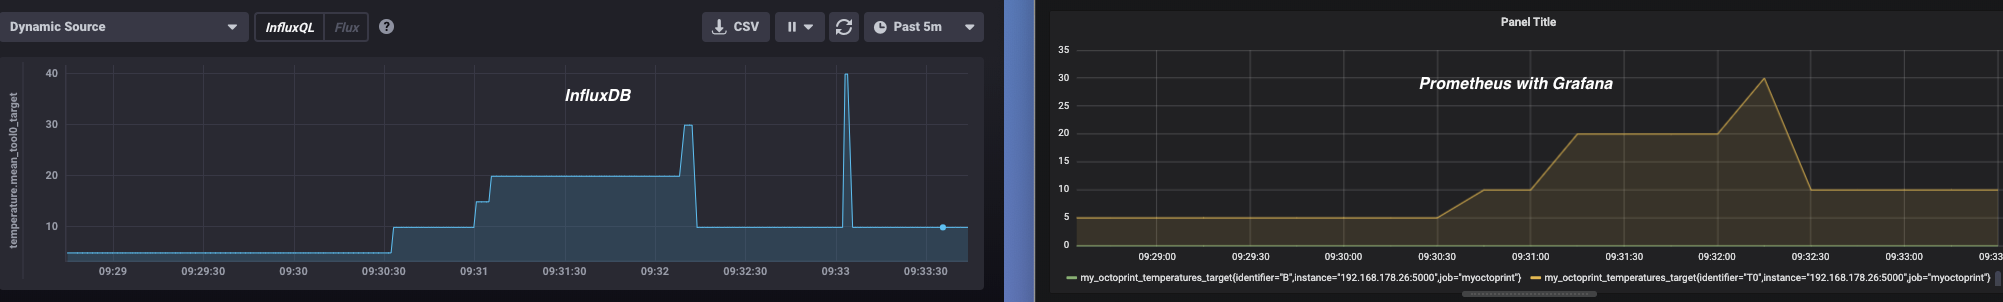
I played around with your plugin, prometheus and grafana.
Btw. setting up a fresh docker based infrastructure of the toolstack during a trainride is not the best idea It takes 2-3h or Hanover-Wuerzburg and a lot of restarts, wifi is not the best.
Currently, I am not so happy with the prometheus pull approach. The default setup pulls every 5 seconds to get the newest values. If you have value changes between the 5 second frame, there are not covered.
Of course I can decrease the intervall or add a queuing function into the plugin. And also if the connection between prometheus and octoprint is broken/not established you don't see it in octoprint.
Thats the reason why I setup a docker based influxdb.
You can see the differnence. The tool-temp. value of 40 is not shown at 9:33 on the right side.
IMHO: Prometheus is an easy to use monitoring solution for server/container with out of the box queries, but not usefull for (near)realtime/or event based monitoring.
Maybe I missed something, but currently I will try my luck with the influxdb-plugin.
C ya,
Olli
Yes, this realtime event based monitoring is not for prometheus. But you really need realtime data?
The connection lost between the prom and octoprint instance is also a questionable con. I think in ideal situations the "app" should know nothing about the monitoring infra, and should work the same if its monitored or not.
I got this up and running yesterday with Docker containers on Windows, both Prometheus and Grafana setup with persistent data mappings. I am happy to share and/or add to the documentation on GitHub if that helps. However, I am certainly not going to be good at making the dashboards and related queries.
If you could share Grafana config, that would be extremely helpful. Thank you.
Also, I am currently using the PrinterStats plugin on OctoPrint. Do you think it is possible to mine the data out of that plugin before removal?
Yapp, the problem is, that I don't have a full-featured dashboard currently. I still in between to migrate my one printer setup to a three printer setup, while I have a lot of other stuffs in my to-do queue
But: based on this I think if you drop in an issue, and tag davidfeeney he probably can share a board with us.
@OllisGit had an idea with a metric-event-listener stream, but I think it didn't happened yet. I would adopt to such a thing. Until then, if you are a python dev, you can try to adopt some of the PrinterStats code to my lib as a PR
 )
)
 I will do a push probably today, but I get a new hw and try to make it work first