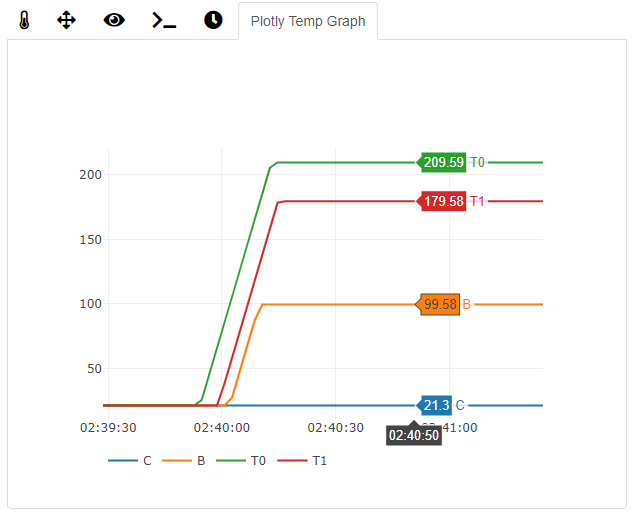
So I've started working on a temperature tab replacement that utilizes plotly for graphing and hopefully will be easy for other developers to submit additional temperature data via a newly registered hook. I haven't yet started working on the hook part yet. I do have a working graphing solution for the temperatures currently being reported by the octoprint-comm-protocol-temperatures-received hook.
I'm currently only reporting the actual temps and not the target temps, but wanted to get some feedback. Do you feel it's necessary to display target temps, keeping in mind the amount of lines that could potentially be shown in the graph?
1 Like
I would just call it the plotty plugin; perhaps I want to plot mire than just temps (fans, layer times, effective material extrusion)
Good point, thanks. I may just take out the Temp part and leave it Plotly Graph. Those other things scare me a bit because those other things might not be an appropriate scale for the y-axis relative to printing temps.
Perhaps there could be multiple graphs on a single page...
Lol, not looking to create a dashboard plugin, that one is already in the works by @Stefan_Cohen.
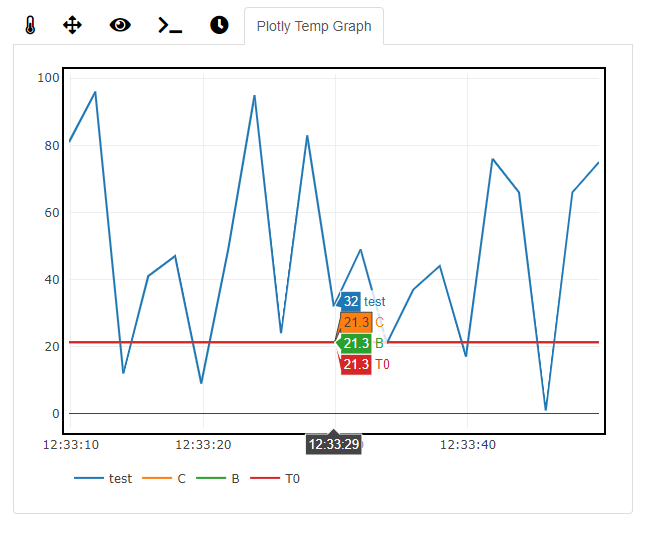
I have a working solution now that is able to graph additional lines on the graph using the octoprint-comm-protocol-temperatures-received hook.If another plugin injects it's temperatures into the parsed_temps return variable then my plugin will be able to graph it, as long as the injection happens prior to my plugin's callback. This is an example plugin I wrote just for testing that injects a random number.
import random

def callback(comm, parsed_temps):
	parsed_temps.update(test = (random.randint(1,101),random.randint(1,101)))
	return parsed_temps

__plugin_name__ = "Test Plotly Graph"
__plugin_version__ = "0.1.0"
__plugin_hooks__ = {
	"octoprint.comm.protocol.temperatures.received": (callback, 1)
}
and the result looks like this...
The only caveat is the execution order of the hook callback, you need to make sure your hook declaration has the tuple defined (callback, 1) so my plugin gets the data after that. You also want to avoid any long running processes in the callback, so best to have the data queued up already when the callback is ran and that way it's just pulling from queued data.
I'm also planning on incorporating an api that data can be sent to it outside of a plugin, but haven't started that part yet. If anyone wants to play around with it it's linked below.
1 Like
Dude, that will be awesome. 
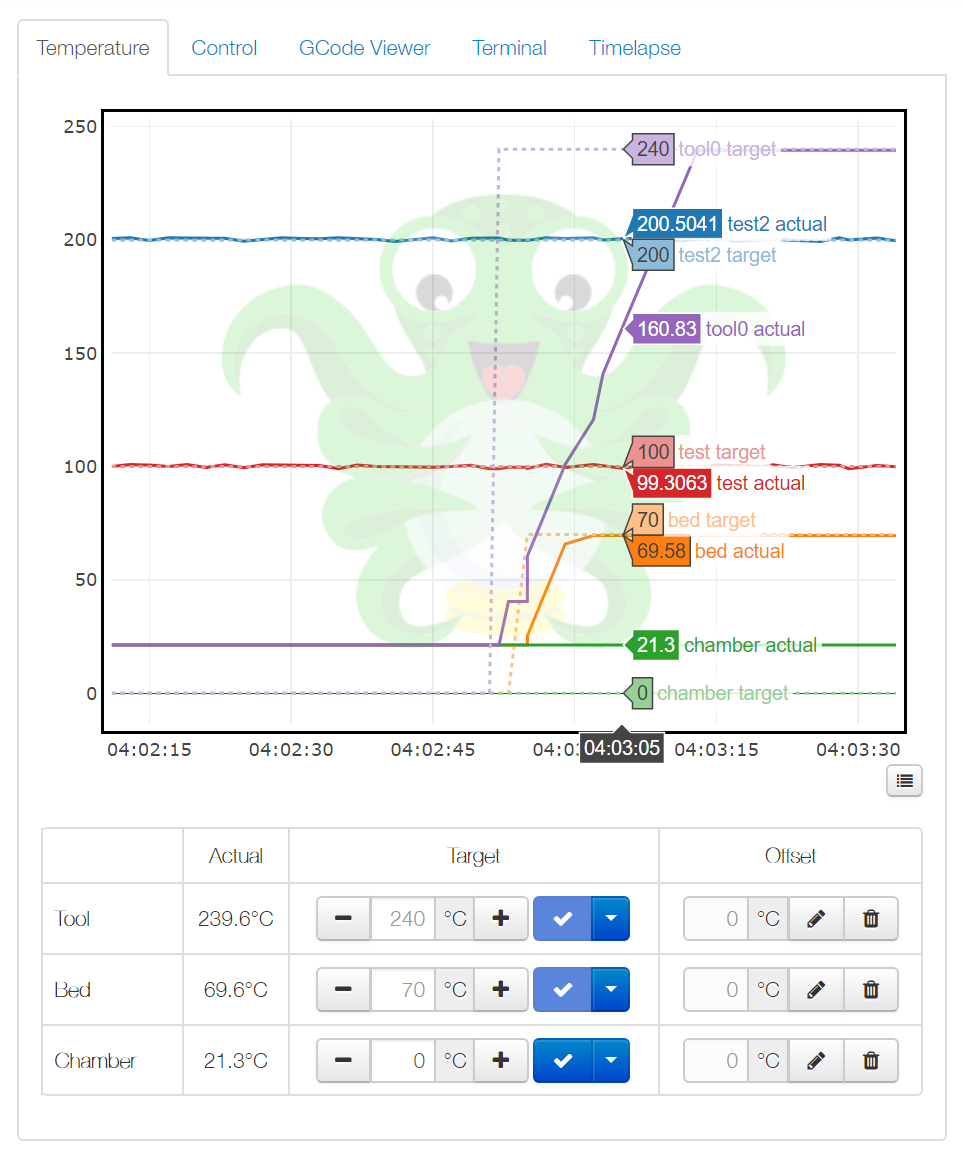
So I've now got the plugin working and operational with a patched OctoPrint server code and a plugin install. Plugin replaces the original temperature tab on install, and should in theory work without a patched OctoPrint, but you won't be able to inject custom temperatures.
If anyone is interested in testing, you'll need to install my patched branch of OctoPrint by installing it with the url below.
https://github.com/jneilliii/OctoPrint/archive/jneilliii-custom-temps.zip
And the plugin can be installed using this url.
https://github.com/jneilliii/OctoPrint-PlotlyTempGraph/archive/master.zip
4 Likes
What would be interesting would be to add a series for the count of Recv: echo:busy: processing as seen from the firmware.
wlan0: flags=4163<UP,BROADCAST,RUNNING,MULTICAST>  mtu 1500
        RX packets 4834  bytes 976354 (953.4 KiB)
        RX errors 0  dropped 0  overruns 0  frame 0
        TX packets 6636  bytes 1380245 (1.3 MiB)
        TX errors 0  dropped 0 overruns 0  carrier 0  collisions 0
It would be a bit like this logistics as seen from ifconfig. I'm not sure of the best way of displaying the information, it might be simply "busy responses" or the "busy-to-sent" ratio perhaps.
In this way (in the future) a user could see when their 8-bit printer controller board is struggling to keep up. For a delta printer this would presumably be a higher number. I don't think we currently know what an acceptable level is for this information. Actually seeing it visually could assist people in the case where they're getting blobbing.