Sorry Ewald, but I was unable to locate any icon to upload photos or files.
Any chance of a screen shot marking the icon to use please?
Ewart,
I think that I have to apologise for coming onto this forum before I fully investigated the problem.
I now realise it is something to do with the Prusa slicer, in that I just loaded the Thingiverse .stl file and compiled the .gcode with my standard 210c settings. So, no wonder I got what I did.
I would like to go away and try to sort this out myself, but, hopefully, if I don't succeed, maybe I could come back and admit defeat!
Again, sorry for wasting your time.
No worries!
If you want to upload data, you may use this button:

or just drag and drop the file into the editor window.
It will appear at the actual cursor position.
OK, Ewart, I give up!
I found a Thingiverse file that had the Gcode for a PLA temp tower, so I ran that successfully,
(with surprisingly little differences between the temp changes from 180c to225c)
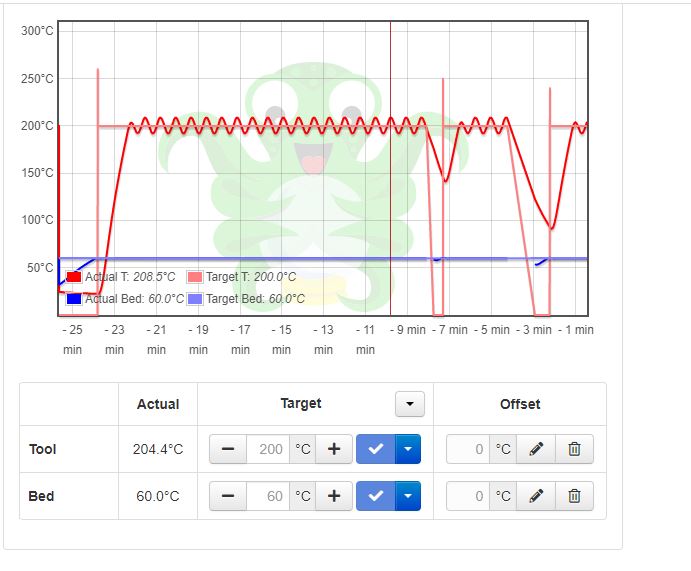
I use a UK made PLA (3DQF) that comes on a cardboard spool for recycling, and they suggest running theire filament a little hotter than most . . . so I decided to go into the Gcode and change all the M104 to higher figures. I attach this file. I also attach a screen dump from Octoprint which shows the correct temp for a start and then drops to 200c and oscillates around it by 10c or so.
I do not understand why. I originally tried at 260 to start with, as may be seen, and reduced it by 10c each time in case the Ender3 wasn't able to cope with the higher temps than I usually use.
i did notice a commented out reference to a .stl file, but I believe that is of no consequence.
I am sure that the answer must be in the Gcode, but I cannot see where.
Any advice would be gratefully received..
TempTower_PLA_240-200_6.5-25_Retraction.zip (788.4 KB)
Ewart. the red line on the chart at 10 mins is my cursor!
You may run a PID auto tune:
https://reprap.org/wiki/PID_Tuning
Also at the start is this:
M104 S240                   -> Set Hotend to 240 °C and do not wait
M105
M109 S200                   -> Set hotend to 200 °C and wait
For the layer change temp you may use M109 too to be sure it is the correct temp.
But as I said, according to the diagram, the hotend needs a PID tuning
There's a few things I can comment on (and hopefully help with)
First, is that screenshot during the print? You should see the "setpoint" changing with your M104 commands (which set the heater temperature). You can check that this is working by trying the M104 commands in the "terminal" tab when you aren't running a job.
Try:
M104 S210 T0
and then check that the tool temp target is now 210C. Try it again and see the values on the chart hopefully change. Even if your ender couldn't reach the temp, you should still see a change in the target. If this doesn't work, I'd confirm that you have the correct toolhead selected (T0 might be different). Otherwise, try removing the .00000 after each temp value (S200 not S200.00000). This doesn't have an impact on my prusa, but your firmware might not like it
Secondly, the fact your red line is wavy like it is suggests you need to tune your hotend PID. This Article should get you going in the right direction.
The reference to an STL in the GCODE file is a red herring. Most slicers will include "metadata" in the GCODE file so other slicers/users can find the slicer settings (you can even embed thumbnails for some printers!). It won't be read by the printer.
Finally, 260 is likely very hot for PLA. 180->225, as suggested, is normally the ideal range. You could try 225/230 as a max, but you'll generally notice issues. As you're aware, this is filament-specific, so tinkering with these values helps (if only you could get the temp tower printing properly!
Hi there Sammy.
Many thanks for your reply and advice.
I followed your suggestions putting in 235c and 123c M104 settings in Octoprint which responded as you suggested it should.
I also removed all the.00000 from the end of the M104 gcode temps as suggested, When I attempted to print, the temp chart looked like the attached . . . it was stuck on the 123c that I entered whilst effecting the previous test!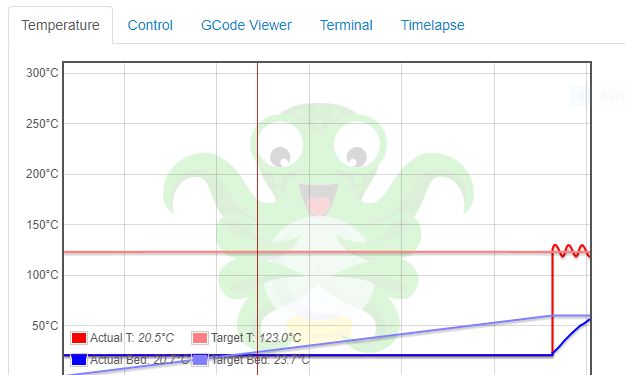
Happily, I have always had a rock-steady temp line in Octoprint when printing. This sine wave was the first ever. I will run the PID check though, as that process fascinates me.
I do wonder why only this particular gcode gives me this problem?
Thanks Ewart
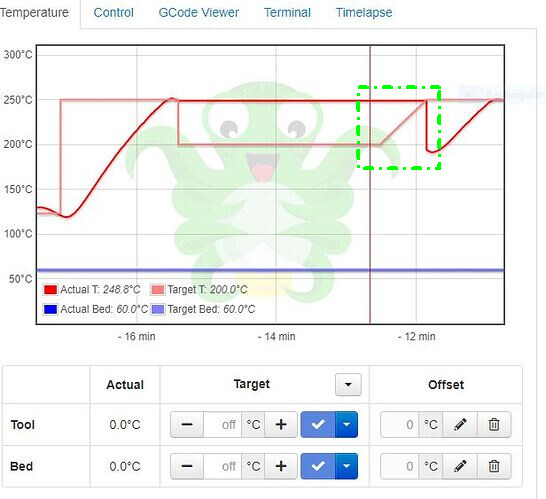
I did a replace M104 to M109 and run the file again, and had this result.
(It may be that not every M104 should have been changed)
I have uploaded both the gcode and a screen shot of Octoprint.
I do appreciate you and Sammy spending time on this.
In the meantime, I am going to try a file that I know works OK to ensure that there has be no sudden change in the Prusa or Ender3.

Do you have something like a SSR between the printer board and hotend heater?
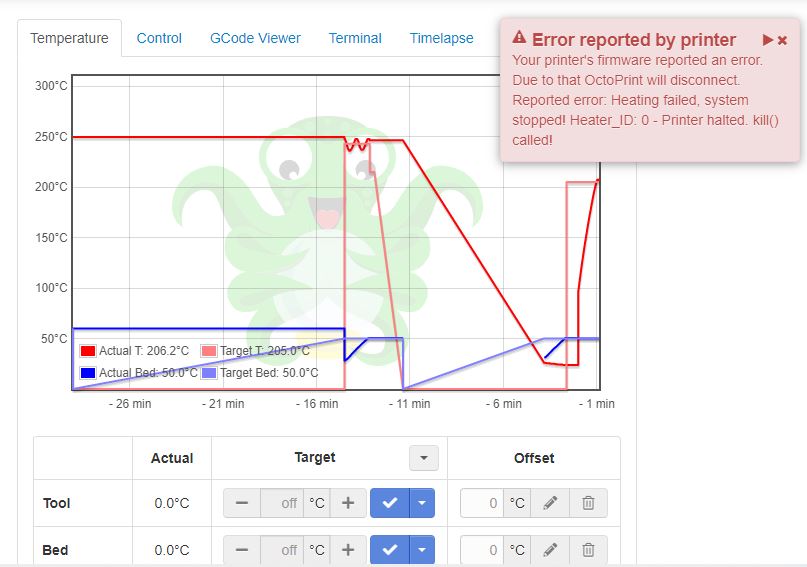
The actual temp should go down when the target temperature goes down.
Also the target temp ramp in the end is quite unusual.
Ewart.
I don't know what an SSR is, however, I may have sent you two gentlemen on a wild goose chase.
When trying to print a previously 'good' file, I had a report back from the printer.
Tomorrow I will pull the print unit apart and makes sure all is well.
I have spare, so I might install that.
If I have wasted your time, i sincerely apologise.
Ewart
SR Solid State Relay . Nope ... bog standard hot end . . . but it looks interesting!
Please share the systeminfo bundle.
There are weird things going on:
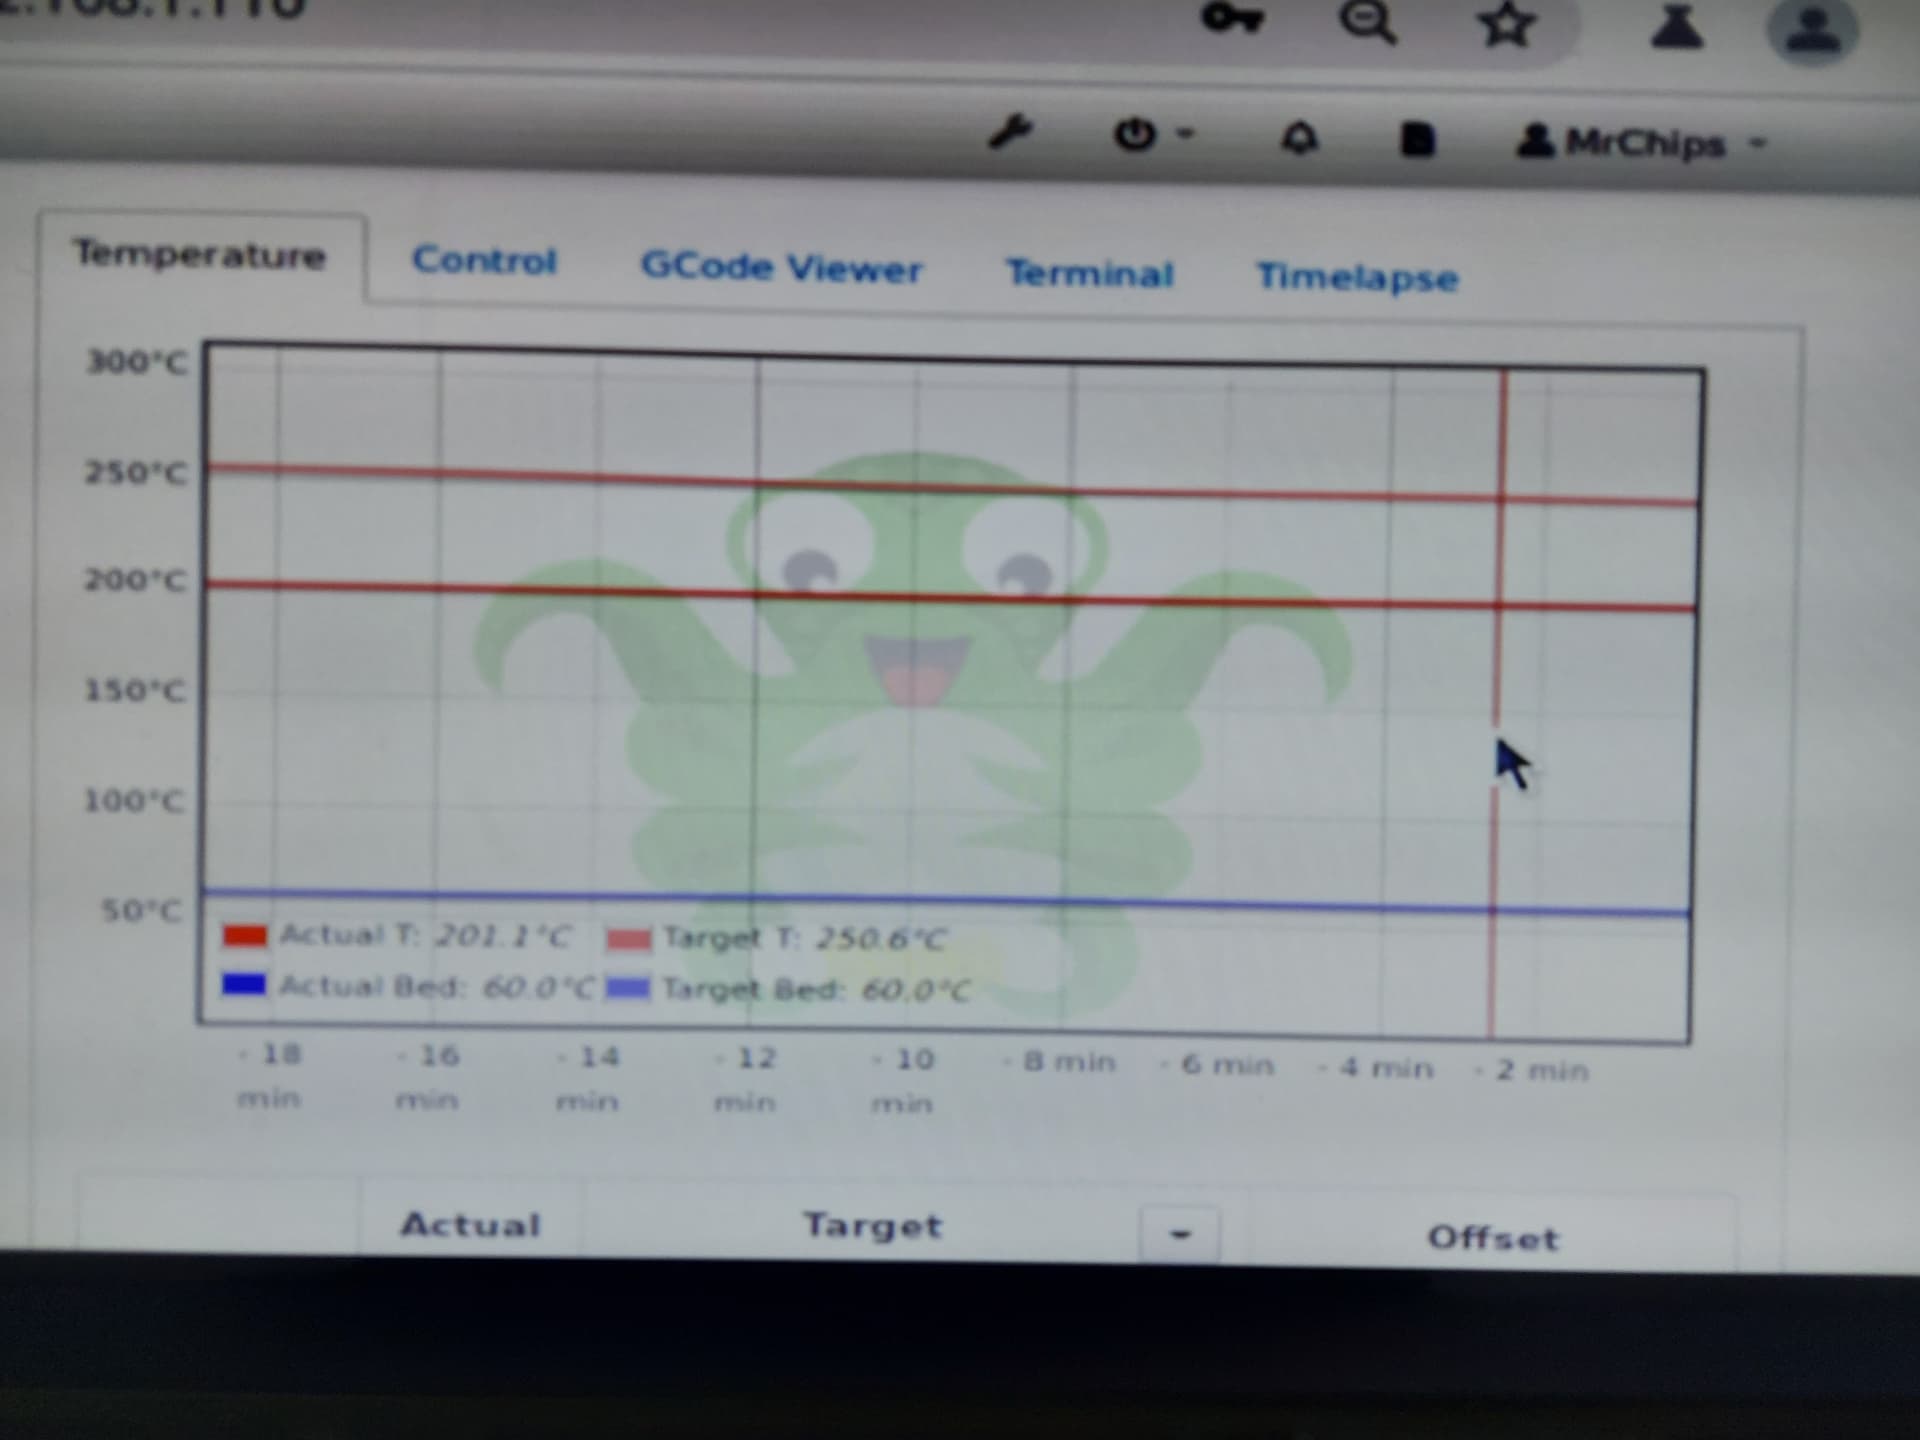
@1: the target temp is 0 but @2 the heat is at 250°C
@3: the target is at 240°C and the actual temp is oscillating. This is a sign that a PID tune is needed.

I assume some issues with the serial connection too.
And I'm still wondering about the ramps with the target temps
Ewart,
Please don't waste too much time on this.
However, system bundle attached.
octoprint-systeminfo-20211206205710.zip (52.6 KB)
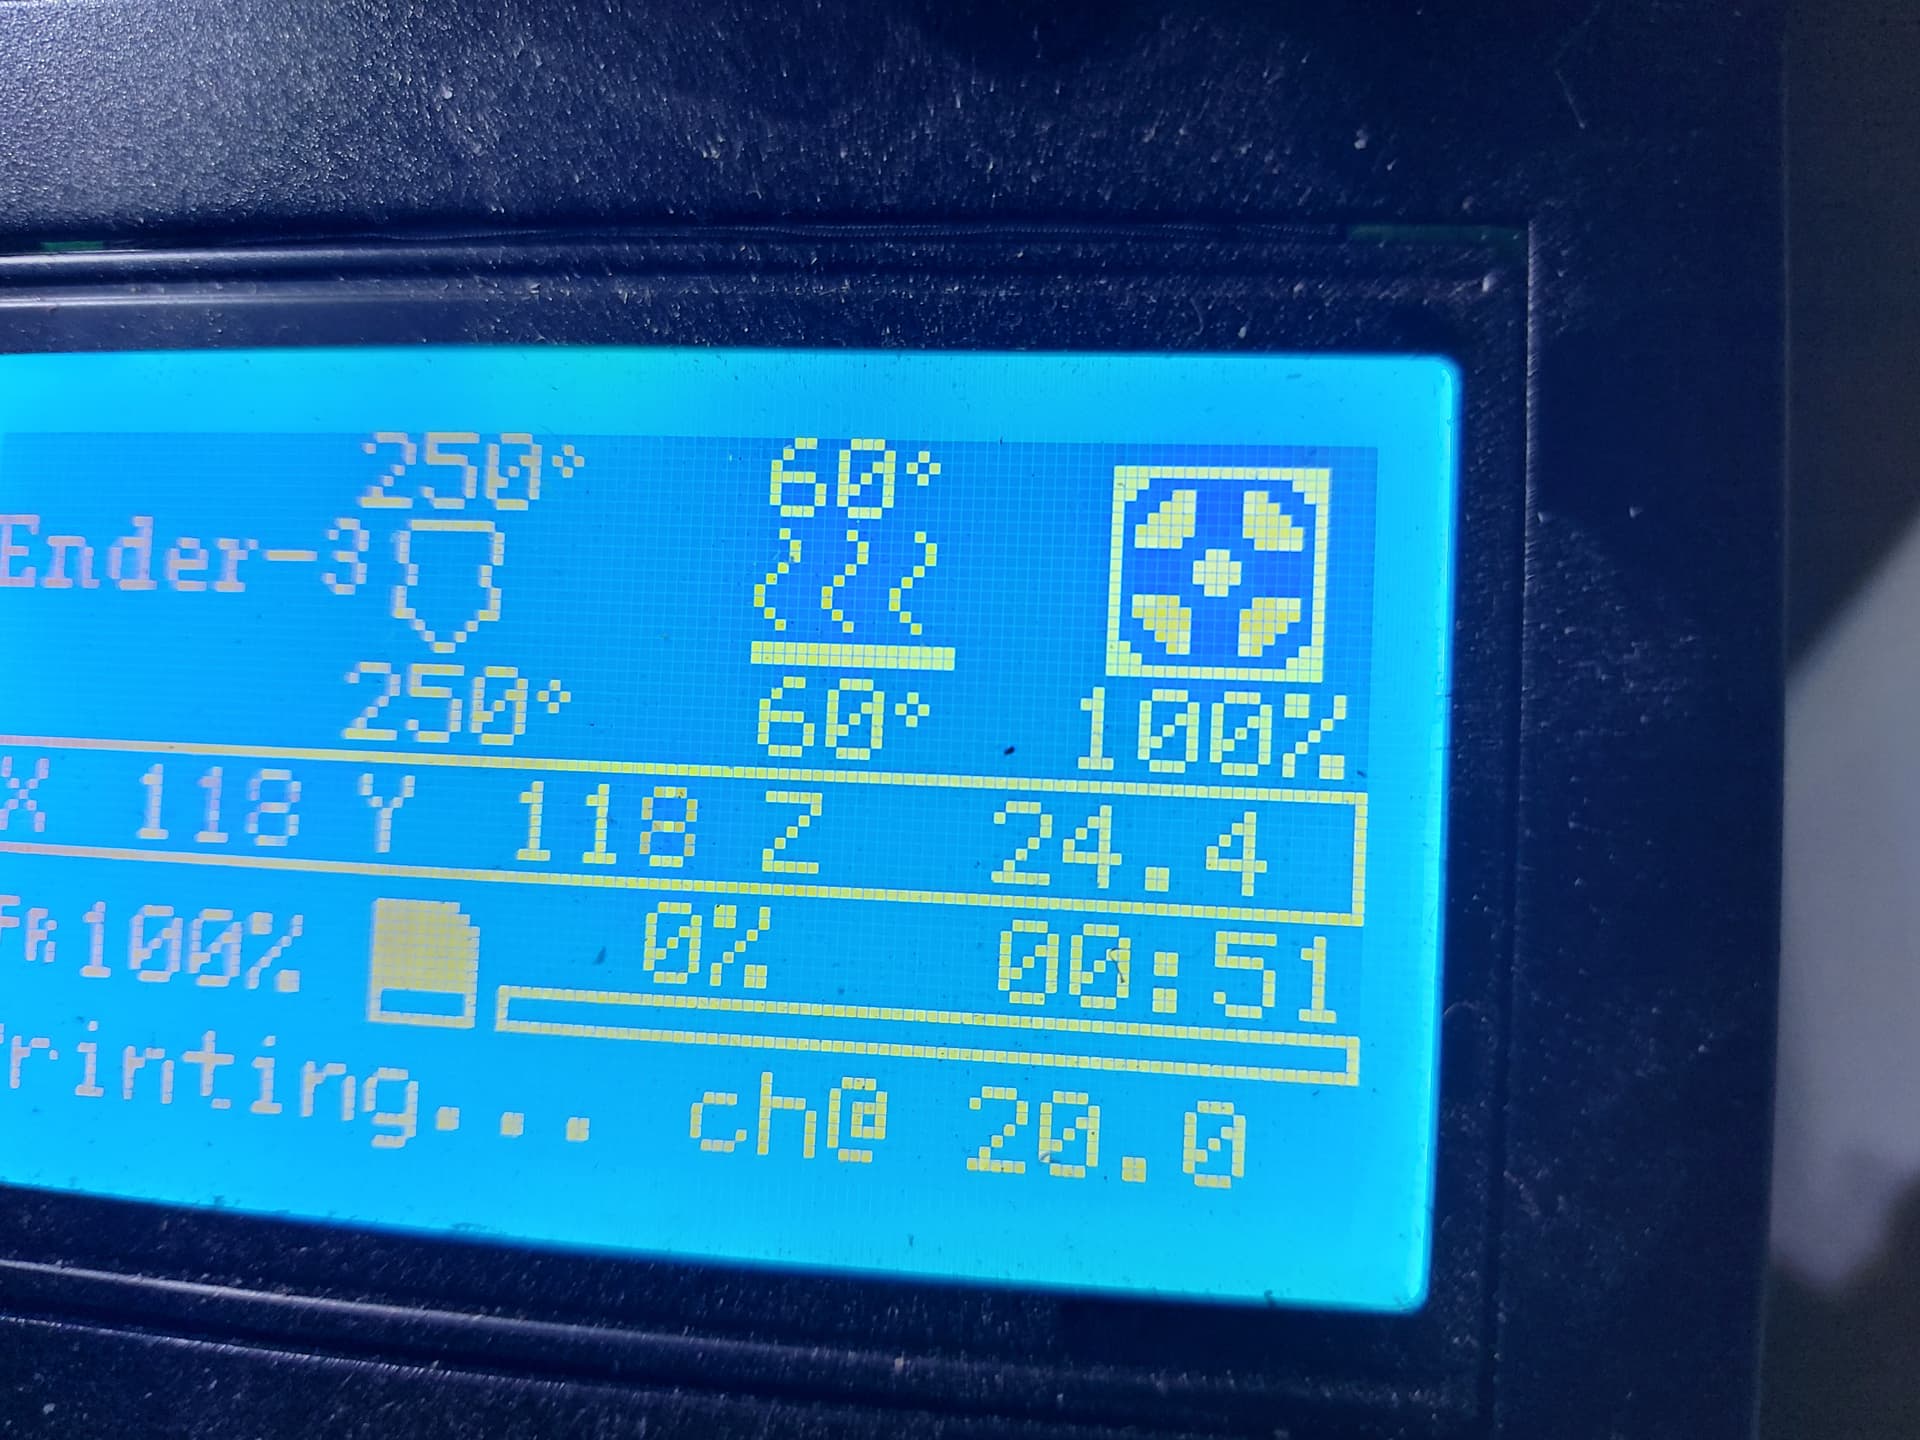
I did say that I would replace the hot end, but instead decided to run the 260-200 temp stack file in Octoprint on my Rpi's browser. The print is coming out fine, but the Octoprint data does not match what is happening on the printer.
The printer is stepping the temperatures, as required, according to the Ender3 display:-
See below please (The forum will notlet me embed images)
The Octoprint via the Rpi shows this:- See below
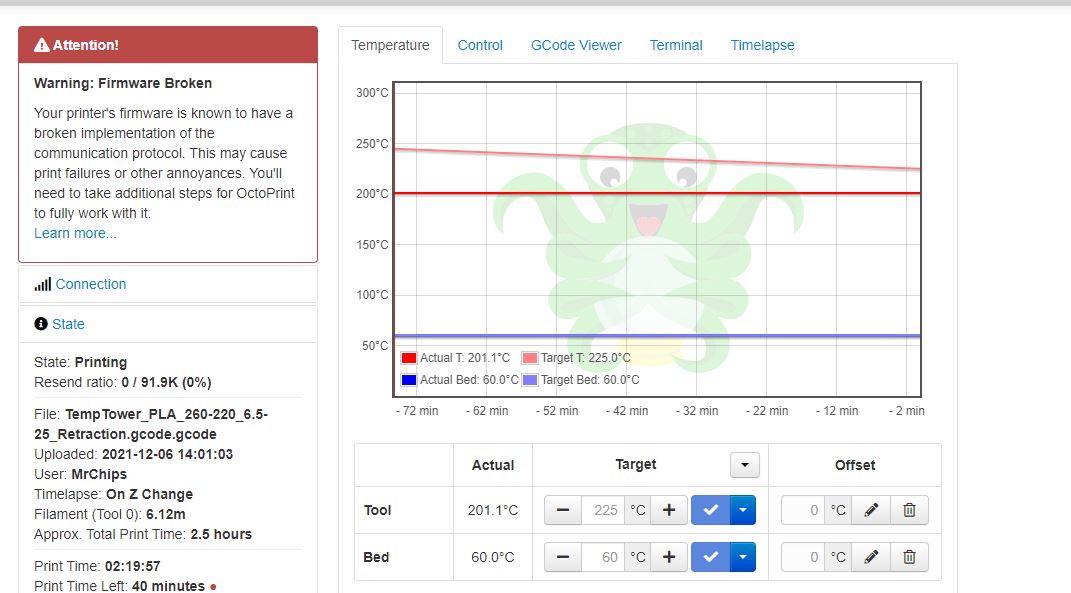
The Octprint on the PC shows this:-
Admittedly they are taken at different times, but the variation is obvious. See below
I suppose the important thing is the printer is working as I want, so I will continue to use Octoprint, but ignore what the data shows me.
Real shame, Octoprint and the Rpi was an 80th birthday present from my son, and I was really enjoying it.
I quite understand if you also want to give up on this issue. If so, let me know and I will close the thread off.

I am confused. None of the temperature graphs I see here reflect what I expect to see when printing a temperature tower. I decided to create a very simple test case (see below) and the resulting temperature graph (see below that). I left out the actual printing parts. You may want to change the position of the nozzle, the temperatures, and the delay between changes but the resulting temperature graph should look similar to mine.
G28
G0 X140 Y140 Z10
M109 S180
G4 S60
M109 S190
G4 S60
M109 S200
G4 S60
M109 S210
G4 S60
M109 S220
G4 S60
M109 S230
G4 S60
M109 S0
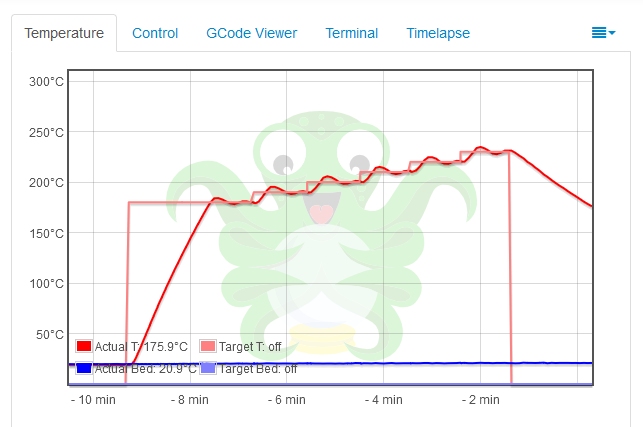
I am cycling through the tool heads on my LulzBot TAZ 6 doing PID tuning and this data was collected before I completed the process for this tool head. Pretty sure this graph would look better after I finish.
Here are the input and output files, Temp_Test.zip (71.3 KB)