I've worked with Flask before and one of my favorite features of Flask is that there is a web debugger that gives the developer the ability to open a Python Terminal in the browser when an exception is raised (and it can be manually induced with raise). I often use the terminal to test methods and debug with access to all of the app variables in that given point in time. I would like the same with OctoPrint because I feel it would save lots of time in plugin development because I can interact with the class methods directly instead of using a bunch of octoprint._logger.info statements. Is there any way to do this in OctoPrint?
@OutsourcedGuru, I read over that, but I’m not sure exactly what to do with it.
I’m wondering if @foosel might know anything about this.
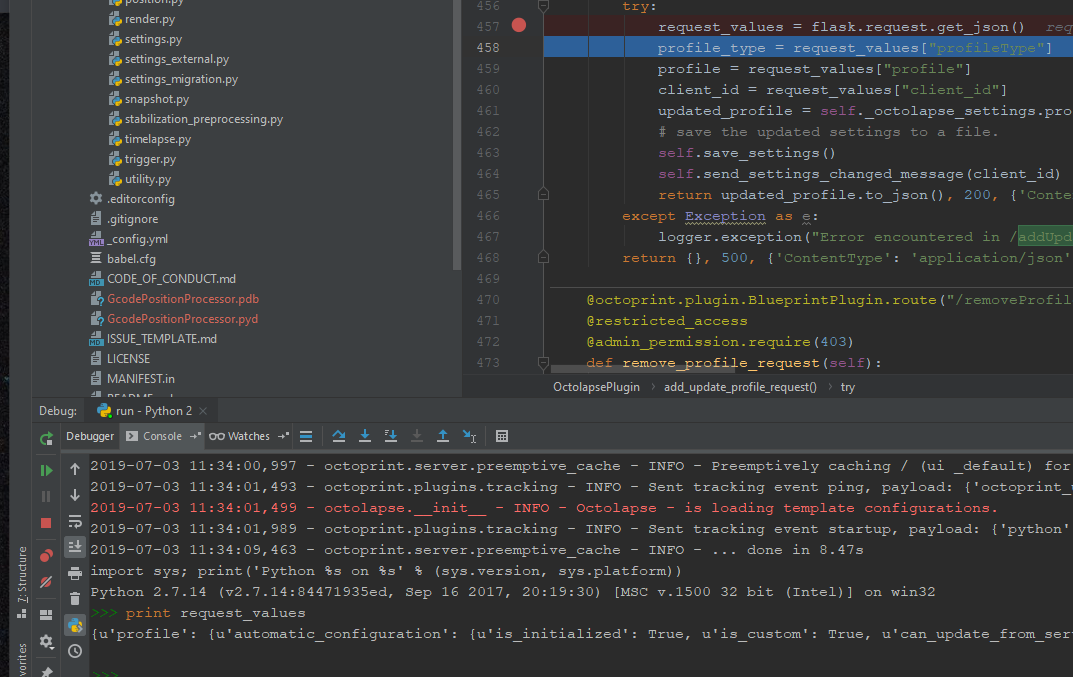
I've gotten both pycharm and visual studio debugging to work with a plugin + the octoprint source, but never imagined it could be done through the browser. What are you debugging with now? It sounds like you are debugging via logging, which is a pain in the butt.
I’ve done logging, but I mainly want a REPL for within OctoPrint so that I can test functions and learn how to use them better. Honestly, the docs are a tad bit missing some stuff. (Or else, I’m not great at looking).