I'll give it a try when my current print finishes. Thanks!
I see date/time spin box at bottom of bed visualizer. So, how do I use it? I'm starting the second bed level now...
Ok, I think I see. You pick the one you want to visualize. Where is the data stored? I want a difference displayed between latest on the one previous.
Yeah, I've been considering doing oerlays but haven't quite had the time to work on it. The data is stored in a sqlite3 database in the plugin's data folder (~/.octoprint/data/blvlogger/ in octopi).
I love the Bed Visualizer. It allowed me to finally get a properly leveled bed.
What I haven't been able to figure out, is what's the purpose of being able to click on the cells of the Adjustment angle table? Clicking sets the value to zero and I think adjust other cells accordingly. But when and why would I want to click it?
Also, when I load the Bed Visualizer window for the first time, I often see an old image showing an old measurement. It is not the current or the previous measument. I do recognize it being from one of the very first times I ran BLV. How can I store a more recent values?
The adjustments table feature wasn't programmed by me, but the idea is that if you click on a probe point that is equivalent to a screw location then that sets the "base point" for adjusting the other 3 screws. It technically only makes sense if your probe points are directly over your screws.
This depends on if you are using the store mesh option or not. If you don't have that option enabled it will always run the configured update mesh command that you have set. This could be helpful for example in the case of UBL, and you're just using M420 V for your update mesh command like I do.
Another option is using the commands in your start gcode scripts if you level every print and your firmware supports M118 echo commands. The idea is that you add the command M118 E1 BEDLEVELVISUALIZER just prior to the G29 command and that will trigger the plugin to collect the mesh data, and if the store mesh option is enabled it will automatically update the graph as that is processed.
Question? I have an Elegoo Neptune 2, does any one know what gcode I put in to get the data? It doesn’t have auto leveling. Thanks for any input.
1 Like
If it doesn't have auto-leveling it might not be possible, but if it has mesh leveling it might be possible. See what M420 V returns on the terminal tab.
So far I only used Bed Visualizer by having it do the probing itself and that worked as expected, but since on my Ender 3 Pro the bed isn't very stable (read: I remove/replace it continuously), I have a G29 before every print and hence started wondering whether Bed Visualizer could not just capture the output of that command and store that for subsequent visualizing (I don't like storing the result with M500 because I cannot limit that storing to only store the bed level and might have manually overruled other settings that I do not want stored). Looking for a solution, I saw your post above that I could include M118 E1 BEDLEVELVISUALIZER before the G29 in my slicer ... but I was wondering ...
If Bed Visualizer can capture the output of the M118, can it not also capture the input G29 and offer an option to capture all output of such G29 commands (or better: of a configurable regex of commands)? That would allow configuration in the plugin for capturing all leveling results without having to touch various slicers one might use ...
I'm already using regex to extract the data and look for mesh data being returned for several firmware variants. In order to minimize the impact of collecting this data, rather than inspecting every command that comes across the serial line from your printer it looks for that specific one and only processes the lines received after that is received. This allows for printing from SD card to collect the data as well as from printing from octoprint local storage. If printing from OctoPrint you could include the same @BEDLEVELVISUALIZER command just prior to the G29 command and the same would happen, just not from sd card.
I tried to install this but it won't work.
It's not in the official repository and trying to upload the zip file gives a pip failure.
I've been searching in vain for info on how to configure bed visualizer and exactly what the UI is telling me about turning the screws.
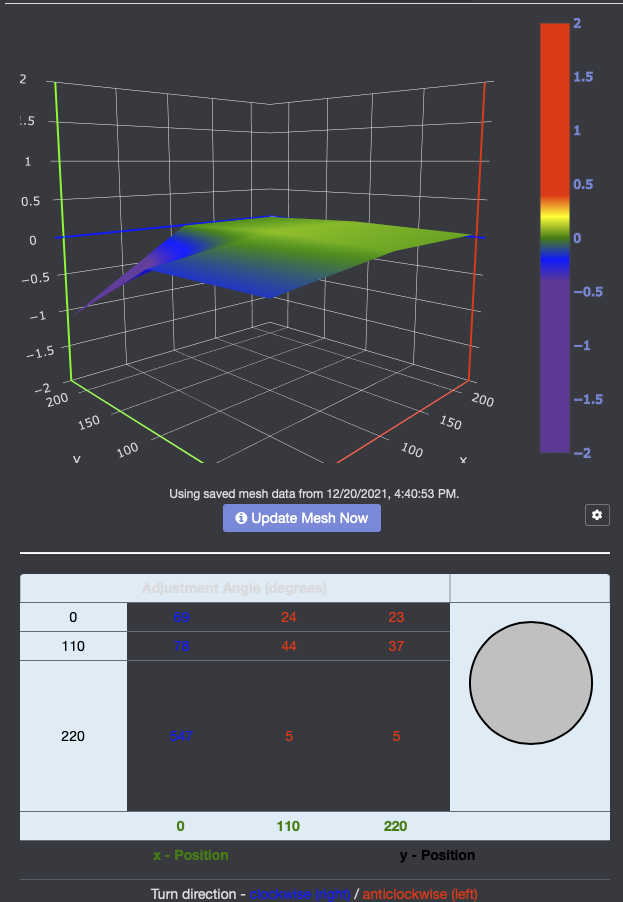
The matrix under the image seems to have the y-axis so that the near edge of the plate (y-0) is to the rear rather than the front.
Also because of my setup with a camera mounted to the left rear leveling screw (x=0, y=220). I want to adjust only the other three screws. If I click on a box in the matrix it shows 0 for that location, and I think the adjustments for the other three screws are relative to that corner, but I'm not sure.
I think you have your assumptions correct about the screw-turning UI. It's not 100% accurate as the screws can be in different places but should be enough as a starting guide.
In the bed level visualizer settings, you can rotate and flip the view. It can be helpful to put an object, like a credit card in one corner to obviously raise it up, so you know exactly what orientation the visualizer is showing.
Presumably you got it installed OK then and don't need help with that bit anymore?
Also using an elegoo Neptune 2 and trying to get bed visualizer to work. Anyone getting somewhere ?
No , I don’t have the BL touch but you make a good point. I wonder autolevling needs to be installed in the firmware which is possible however it disables the ability to manually level.
Yes, some form of auto bed leveling has to be enabled in the firmware for the plugin to be able to work. This does not exclude manual mesh leveling or UBL with manual probe option, which both would also work with the plugin.
Thanks ! I’d like to avoid messing with the firmware , how would I go about doing a manual mesh leveling ? I’m new only a week or so in a having a heck of a time getting first layer down. Thanks !
If it's not enabled by default in your printer's firmware it won't be possible. That also requires firmware changes.
First of all, thanks for the nice plugin! I have an additional question though on the visualisation. Is it possible to edit the visualisation style to something like a heatmap? When I edit the data in the chart studio this is possible of course, but I haven't found it in the Octoprint environmnet. I find it way easier to interpret heatmaps instead of meshes.