What is the problem?
Approximately every 24-48 hours, I'm having a problem accessing my octoprint web interface either using octoprint.local or IP adress from my devices (both android or PCs) in my local network. However, the server is still running and I can still access it by ssh.
What did you already try to solve it?
When the malfunction happened, I was able to:
- connect to octoserver using ssh
- connect to octoeverywhere using the Android app as well as access the web interface using the plugin link on my desktop PC
- ping to my octoserver using my desktop PC
- observe that octoserver has assigned IP within my router GUI
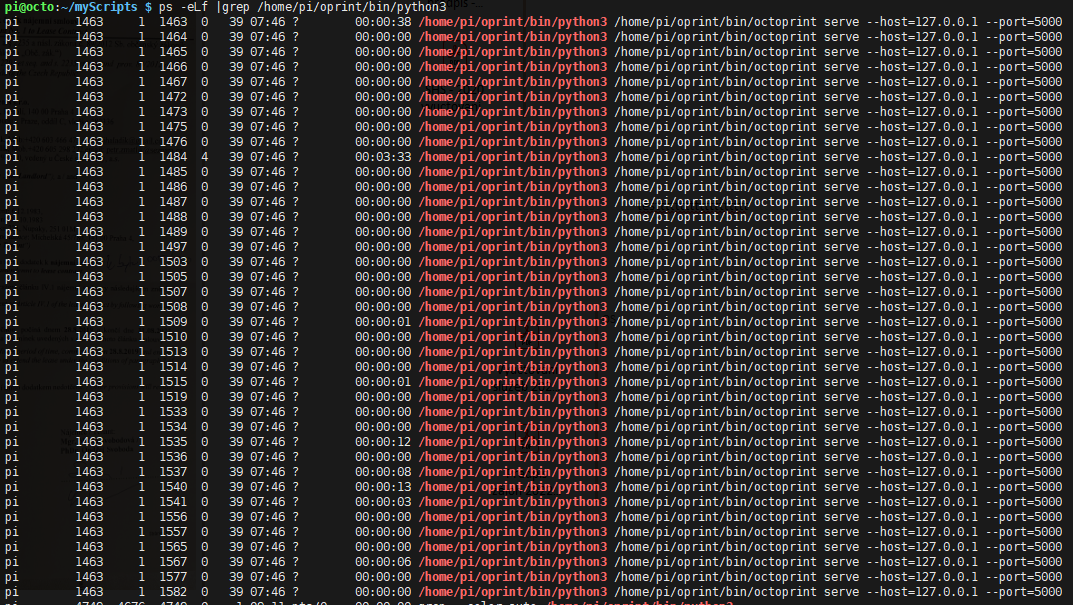
- in a terminal, I was able to check whether octoprint process was running using:
ps -ef | grep -i octoprint | grep -i python
octo_processes|690x389
I was able to restore the web interface connectivity by:
- rebooting the server or the whole Pi
- rebooting my router
Note:
Next time whenever this happens, I'll also post snapshots of
ifconfig
and
netstat -ntlp
commands
I also wonder whether this has something to do with octoeverywhere or ngrok plugins, I run. I still didn't have a chance to disable them and to see, if that solves the issue or not, since it only occurs infrequently.
Next, I would like to ask, if there is a way to access some other logs that would reveal, some more info regarding the port 80 getting closed if that really is what is happening.
Logs (syslog, dmesg, ... no logs, no support)
Here, I'm attaching octoprint.log recorded in between last successful login (00:23:23) and unsuccessful one in the morning (approximately at 06:35:00, obviously this is not shown in the log; the first morning entry is at 06:43:49, when I connected to the server via octoeverywhere plugin instead)
octoprint.log (14.8 KB)
Additional information about your network (Hardware you are trying to connect to, hardware you are trying to connect from, router, access point, used operating systems, ...)
OctoPrint version: 1.7.3
Python version: Python 3.7.3
Pip: 20.3.3
OctoPi: 0.18.0
Server: Raspberry Pi 4 Model B Rev 1.5 powered by 5.1V, 3A adapter
Client: Google Chrome 98.0.4758.82
Printer: Prusa MINI+
Thank you for any responses!
Ondrej