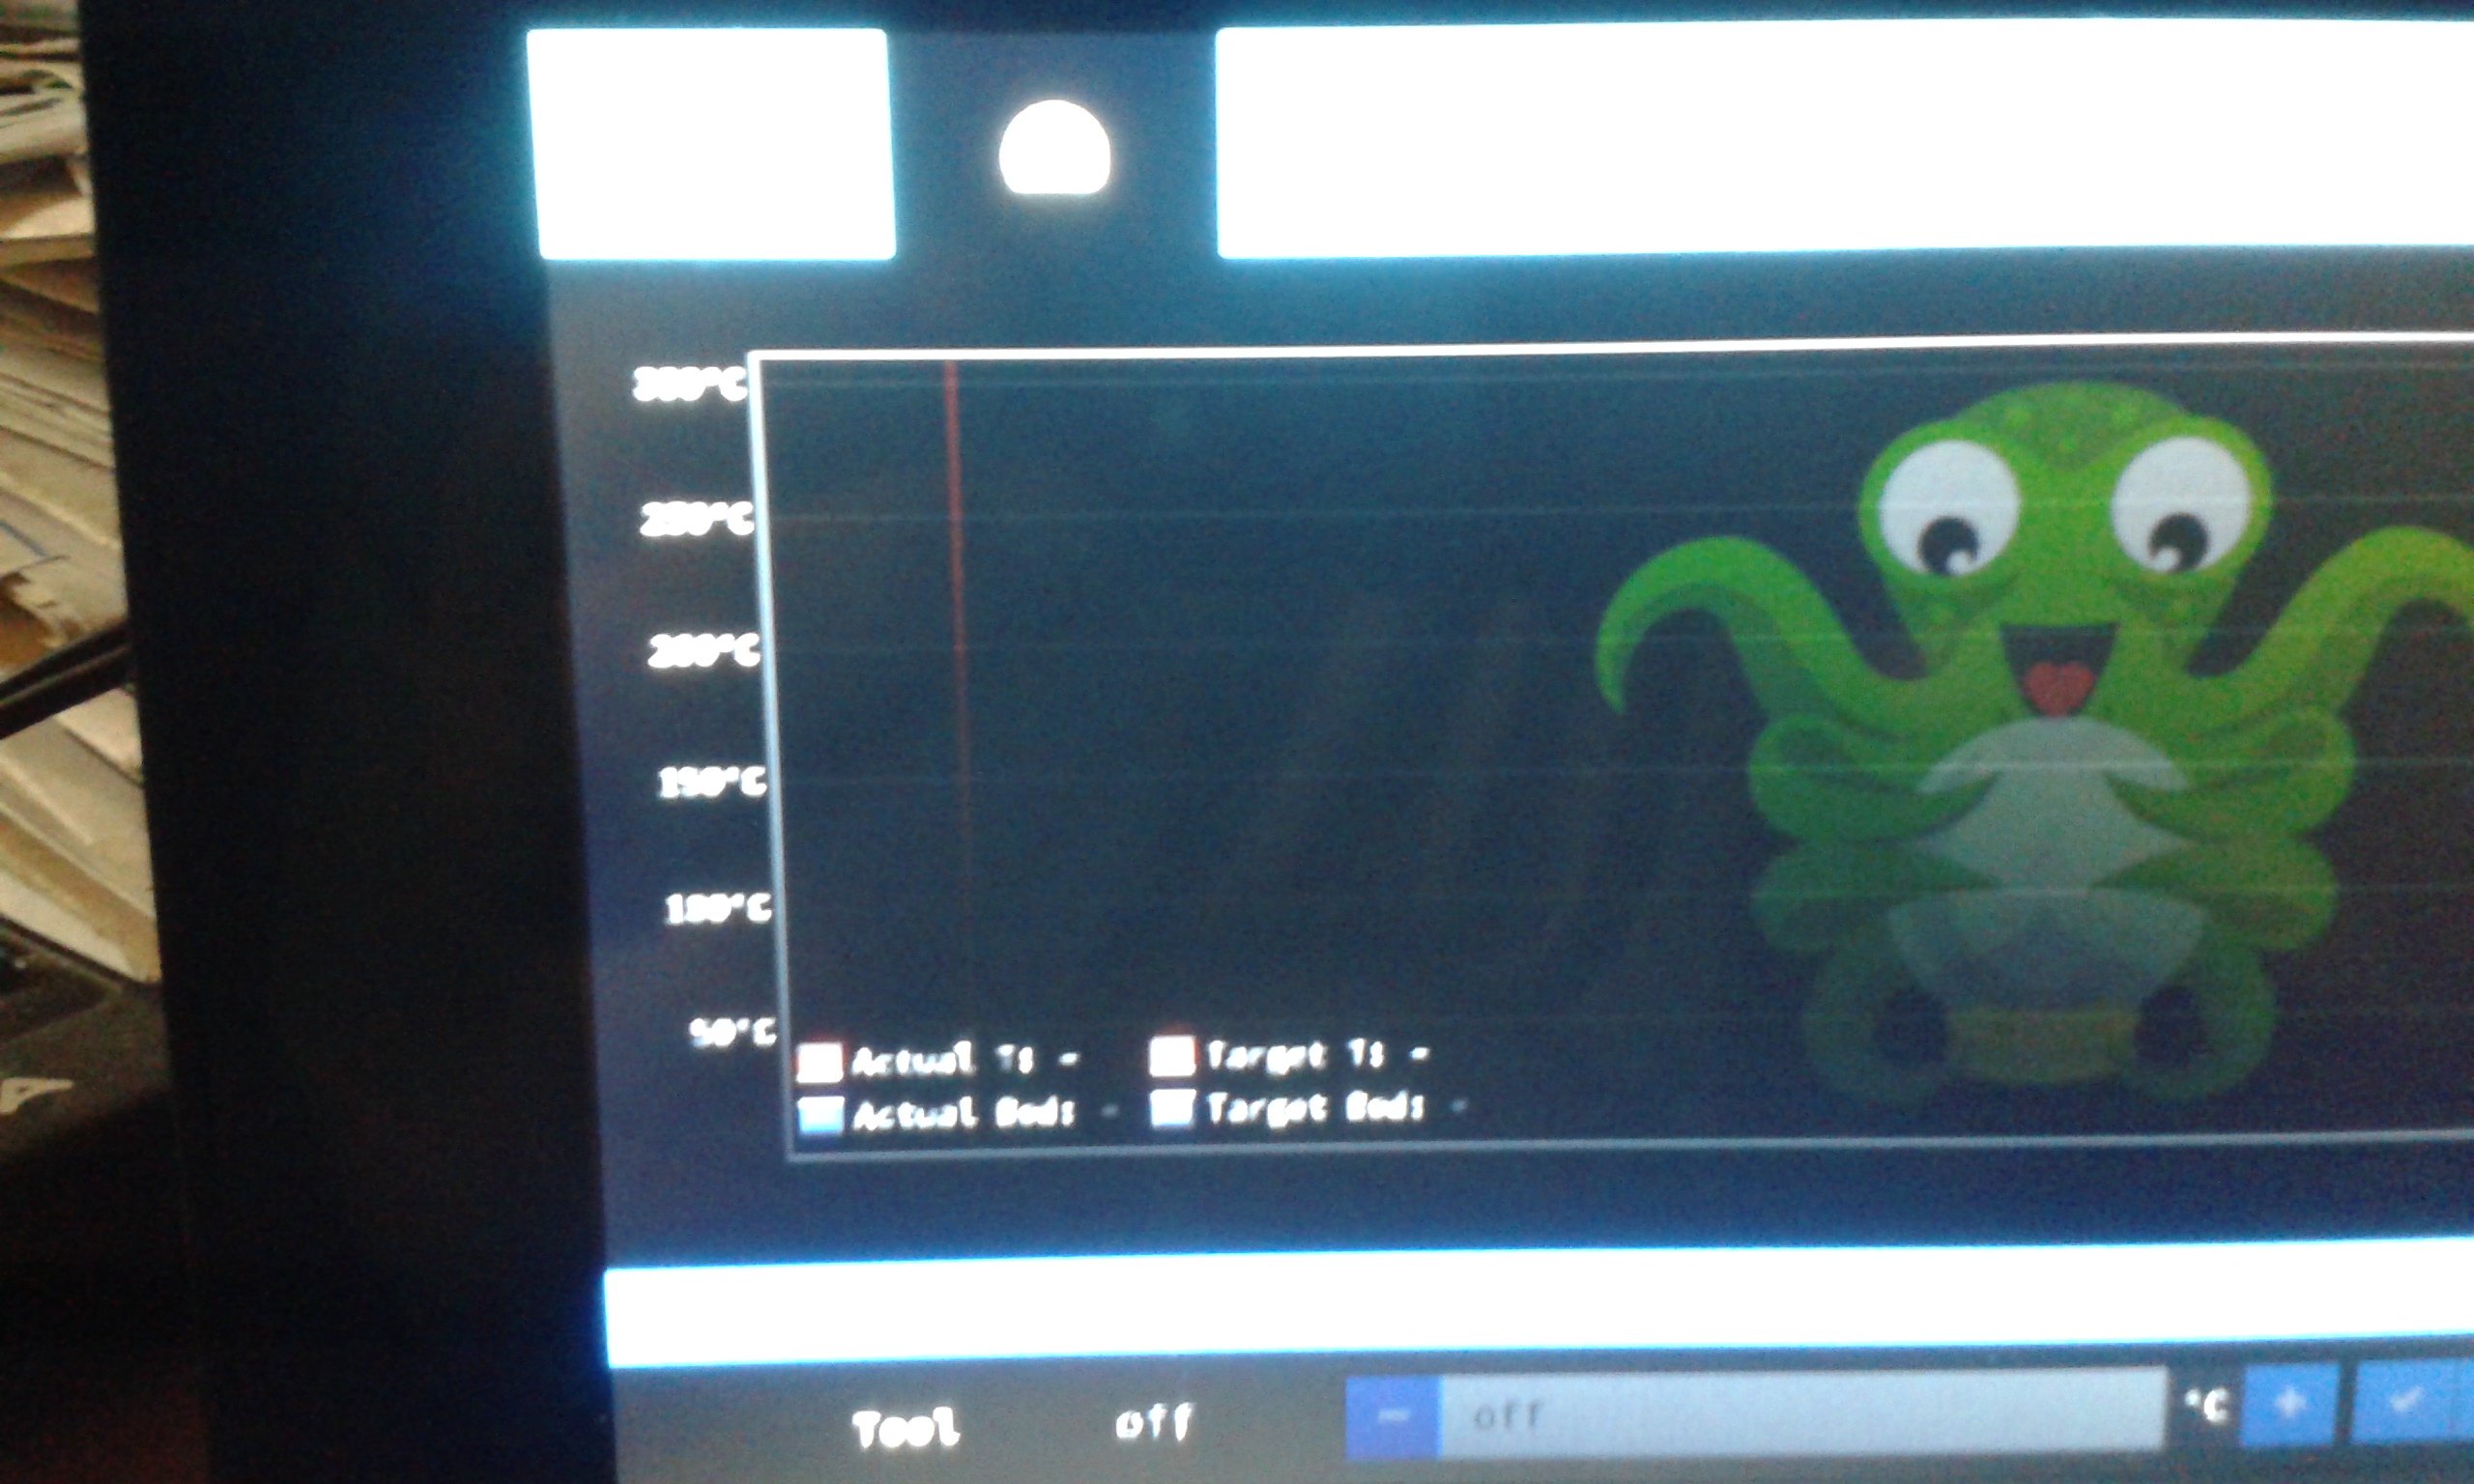
Temperature Scale is misaligned on Graph
Did some searching to see if it's been discussed before with no luck,and tried reading up on CSS but it made my head hurt
OctoPrint 1.3.8, OctoPi 0.15.1, CTC Bizer, Sailfish v7.7
Don't think the logs or terminal tab are relevant in this situation?
Did a completely fresh install on a brand new Rpi3B+ with Official 7" display... couple of brain fart moments until I got my head around the Linux malarkey... never used it before now so didn't do too bad?
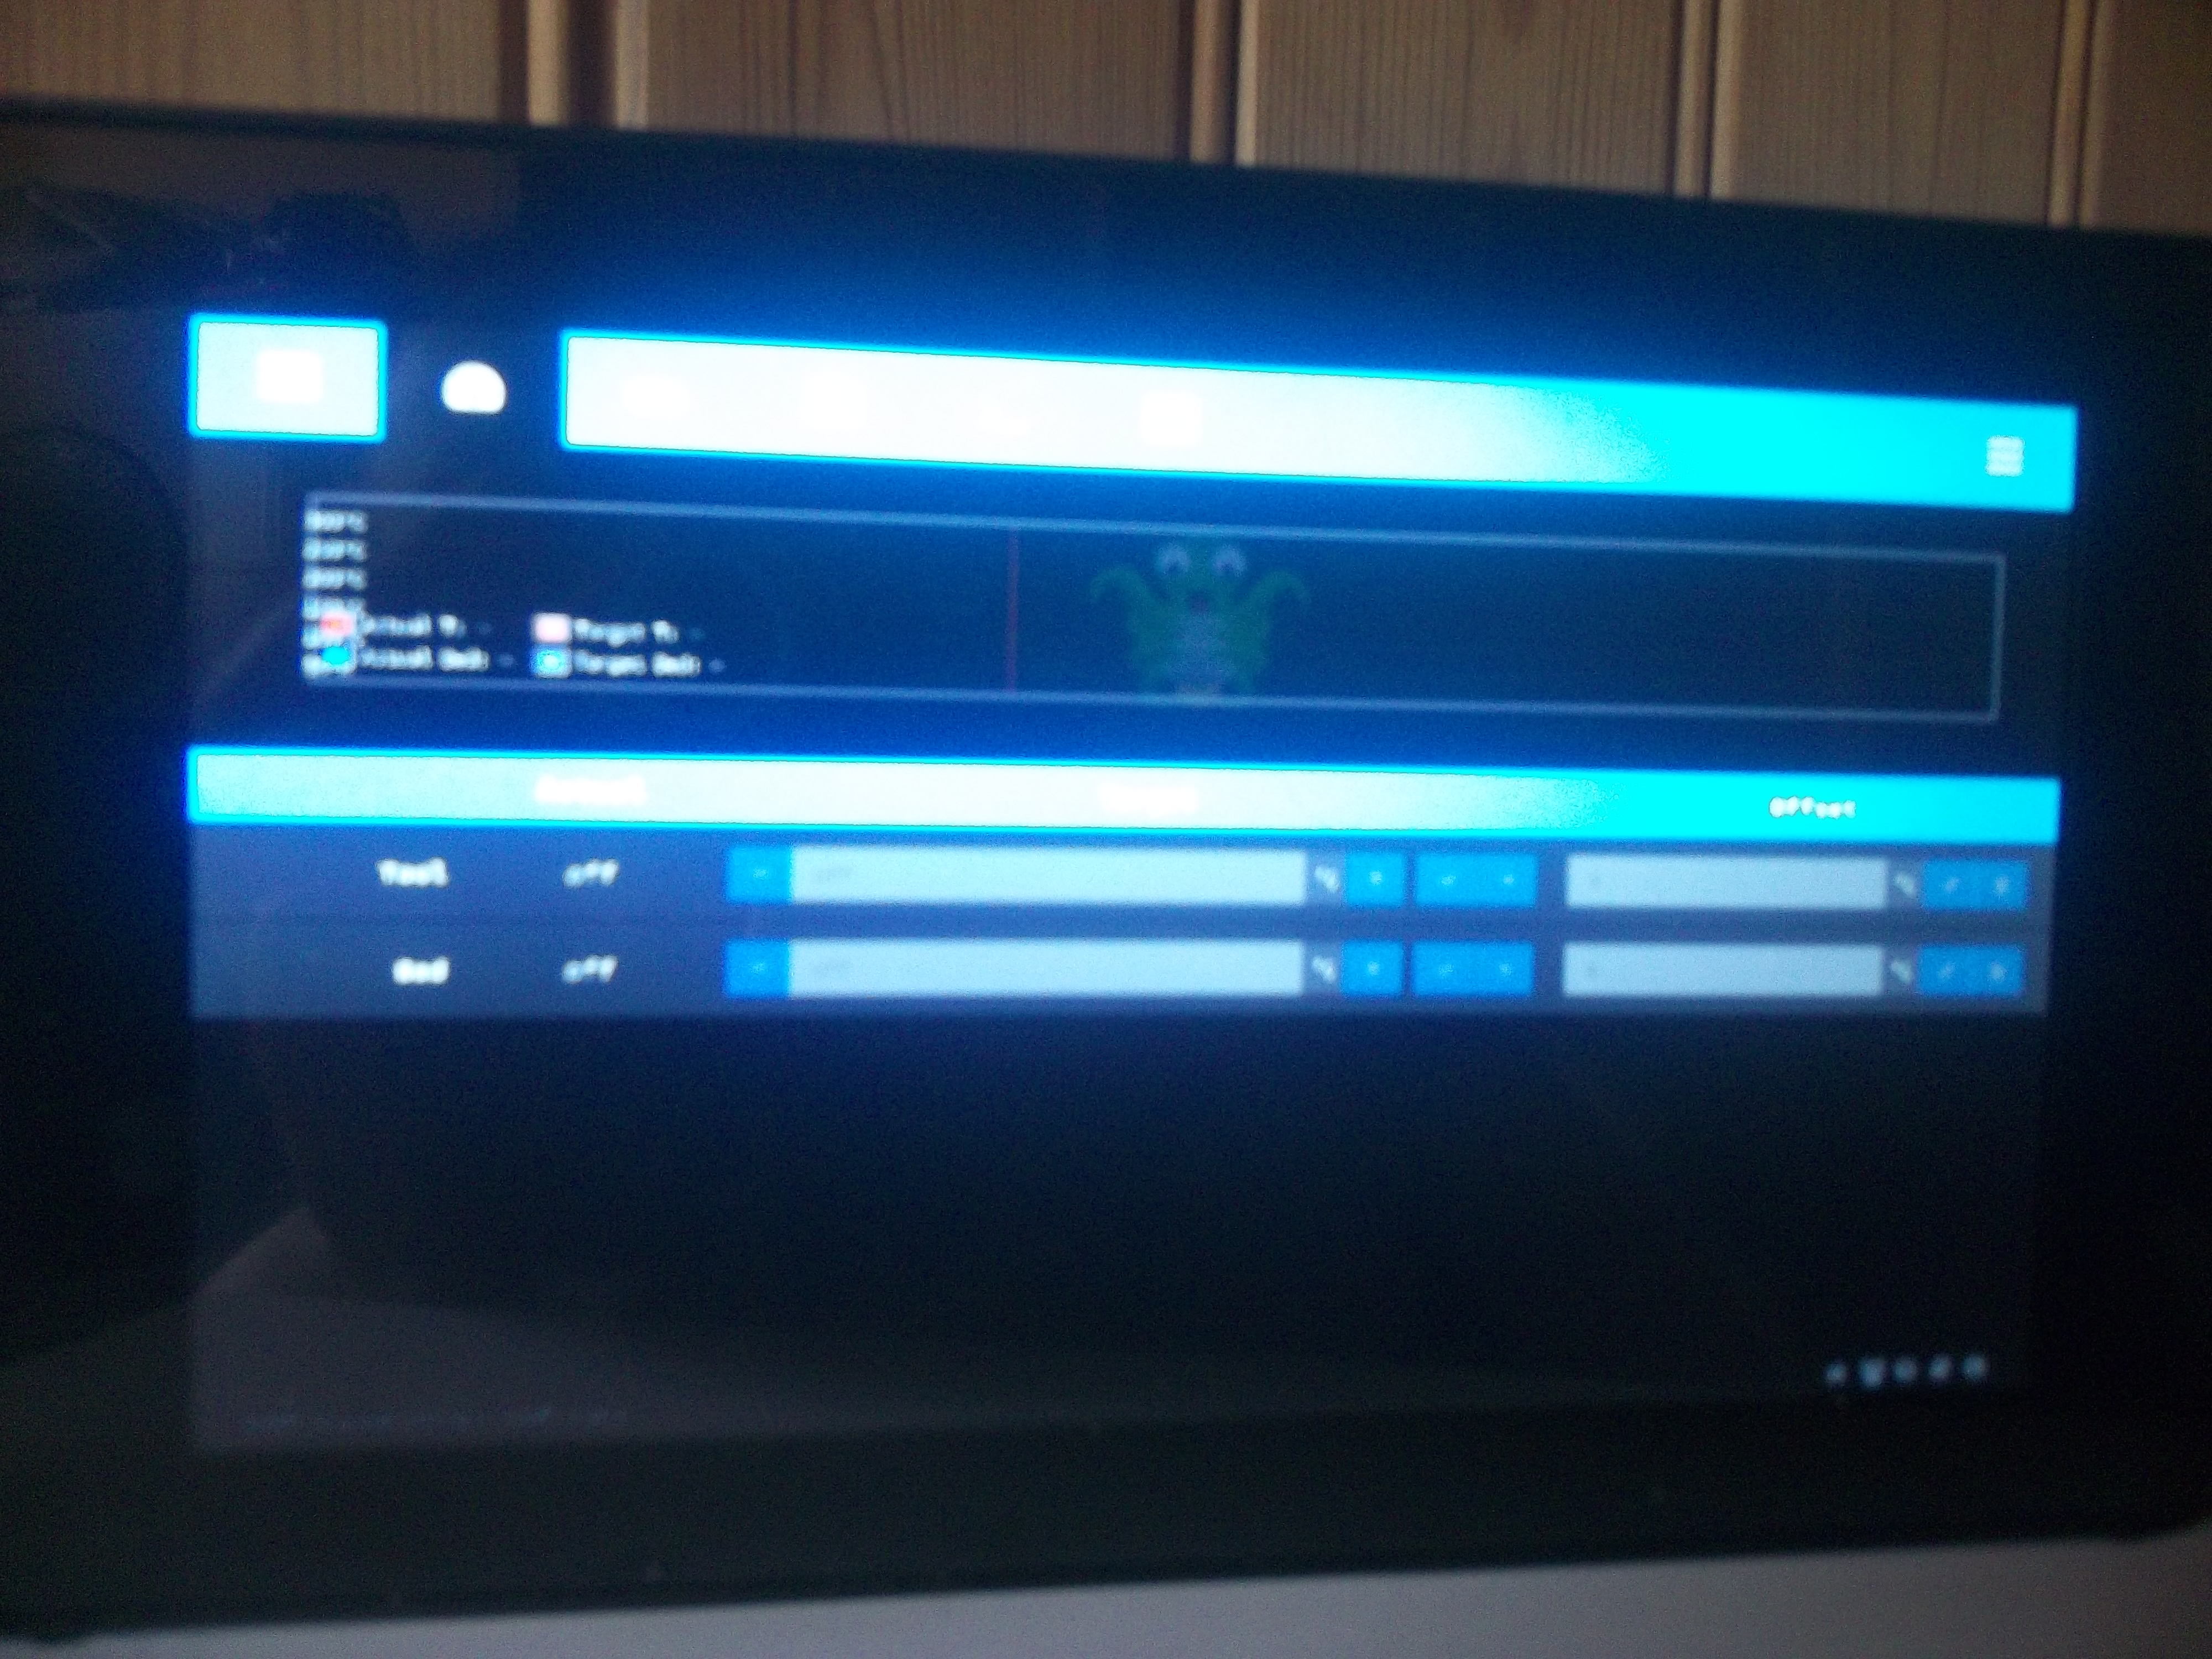
Until it came to the Temperature tab which was all squished and messed up... thought it was something I'd done while setting it up... got some help from @OutsourcedGuru... (much appreciated) in a thread I placed in the Plugin Forum.
Got to the point I thought it might be a bug or something I'd done so wiped the SDcard and started again... but exactly the same thing happened... So now I'm editing a custom LESS file to hopefully display everything better on the 7" screen and fix the messed up temp tab/graph in the process...
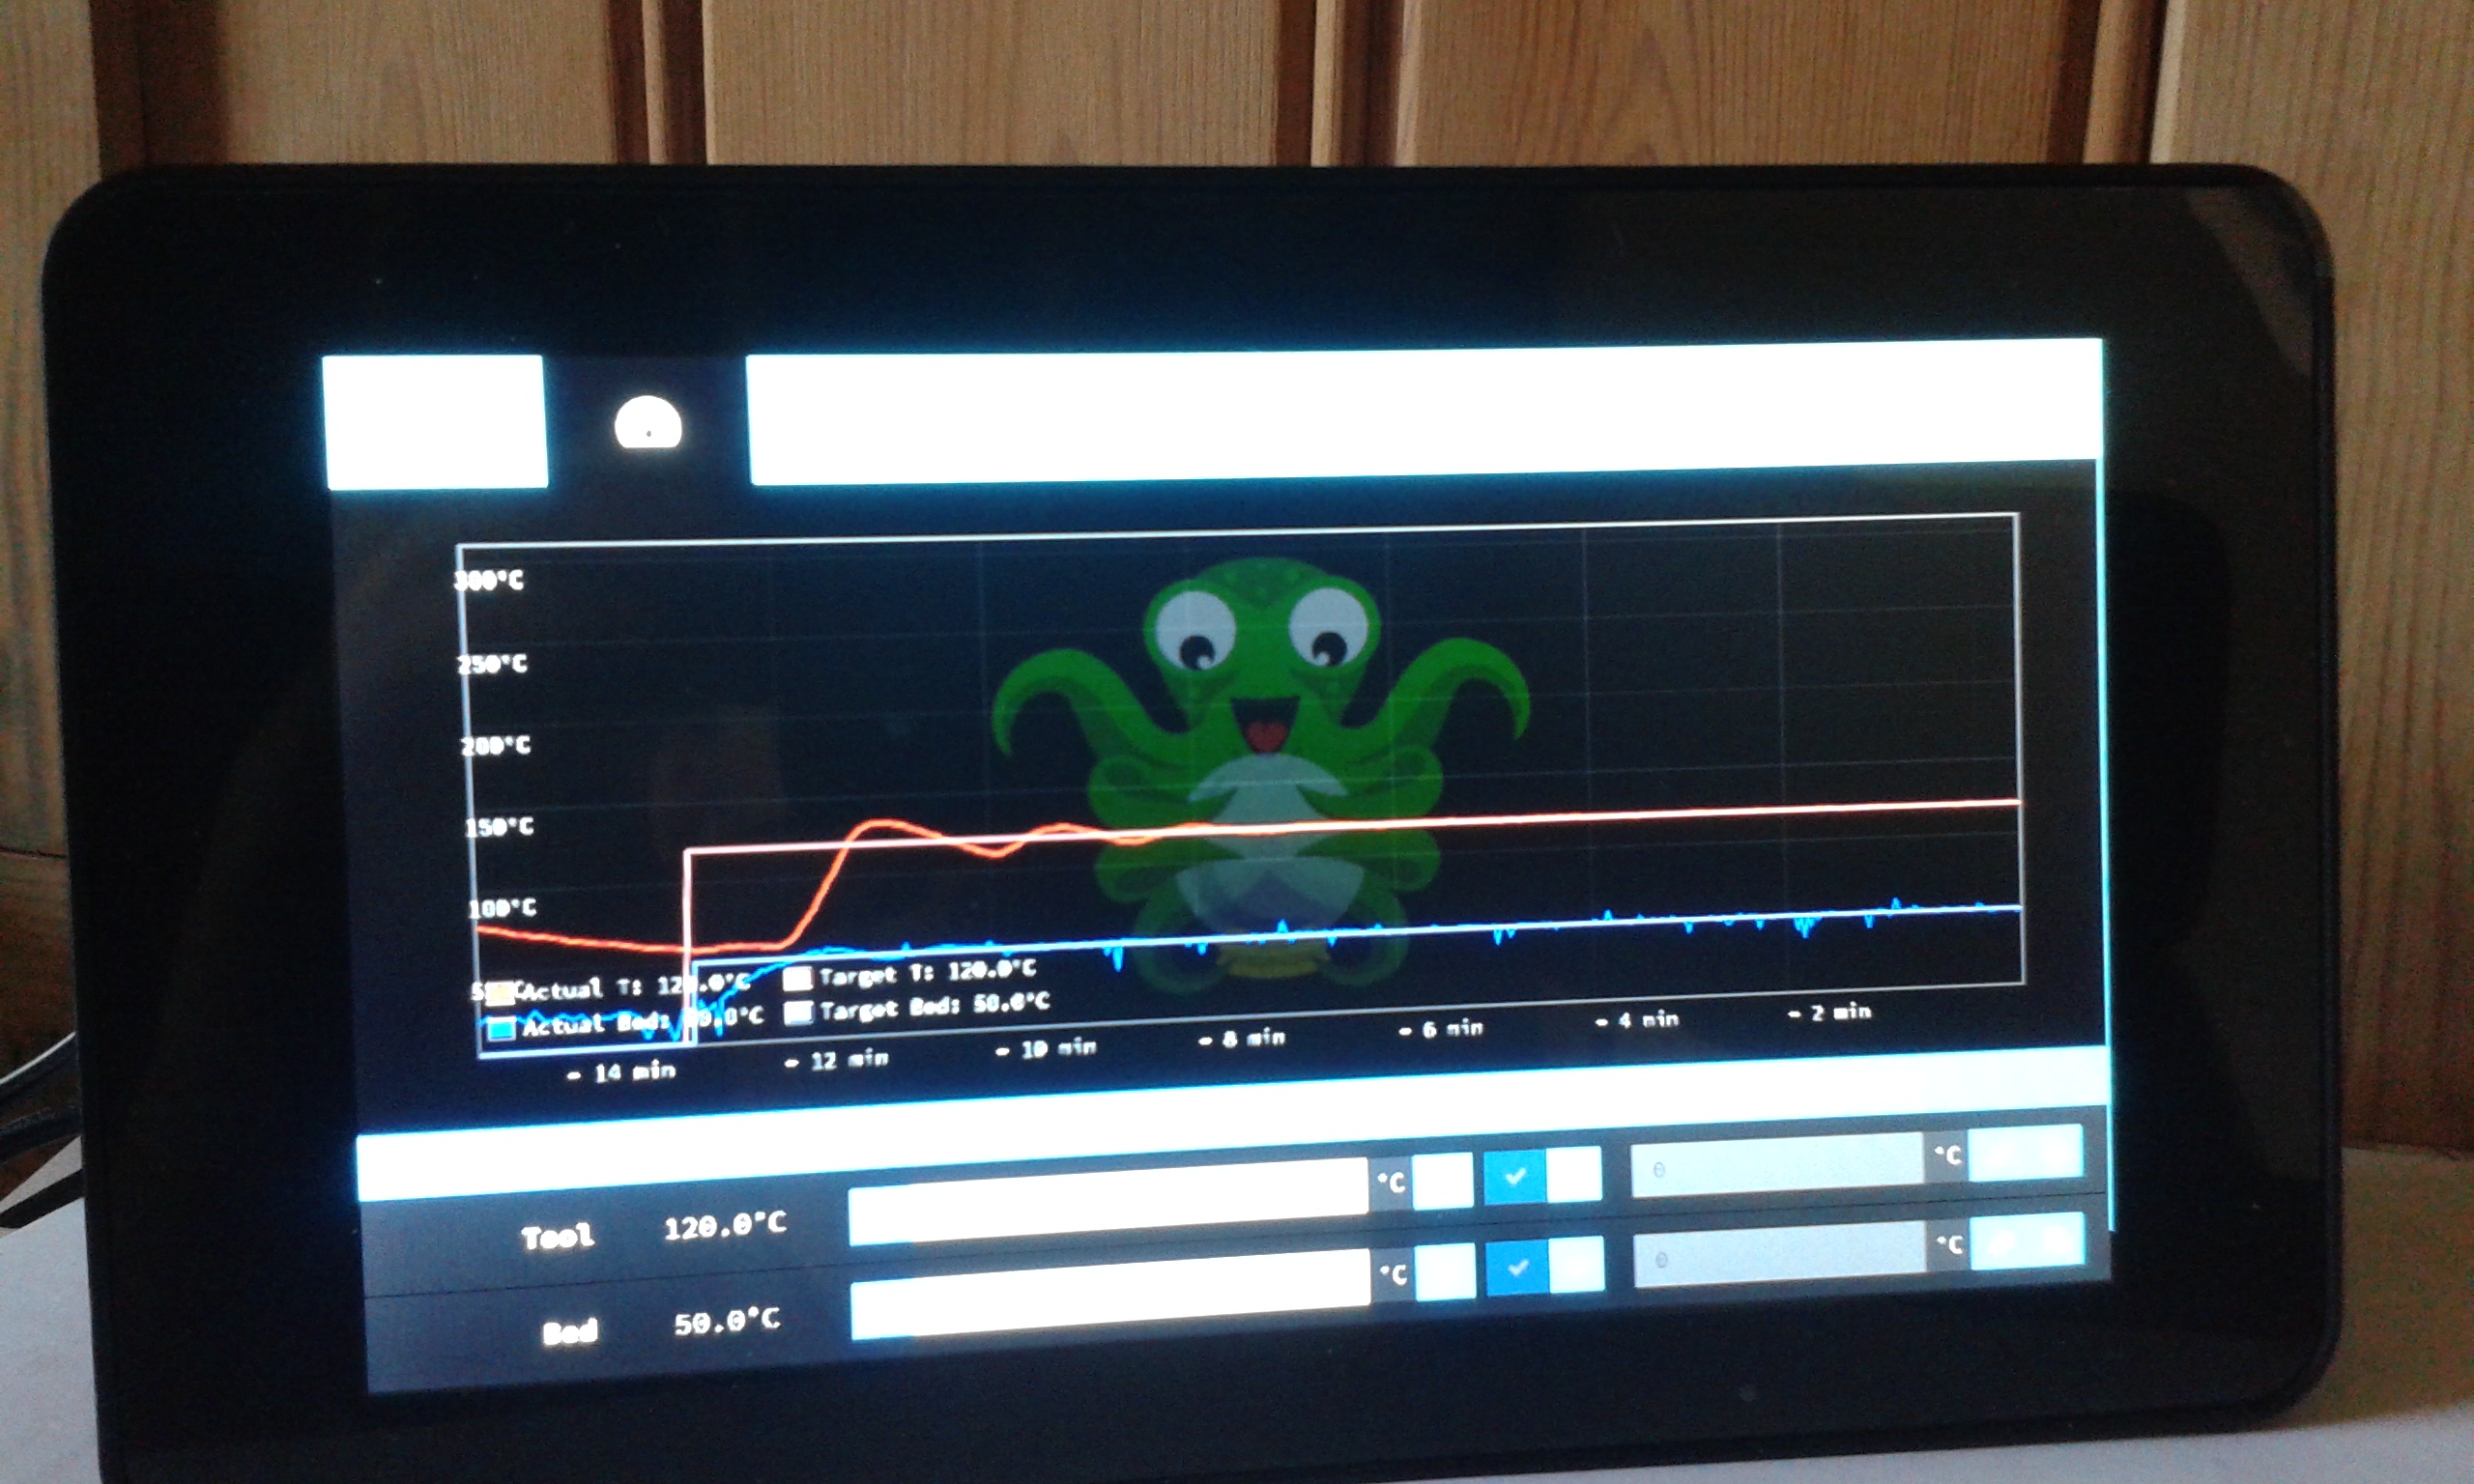
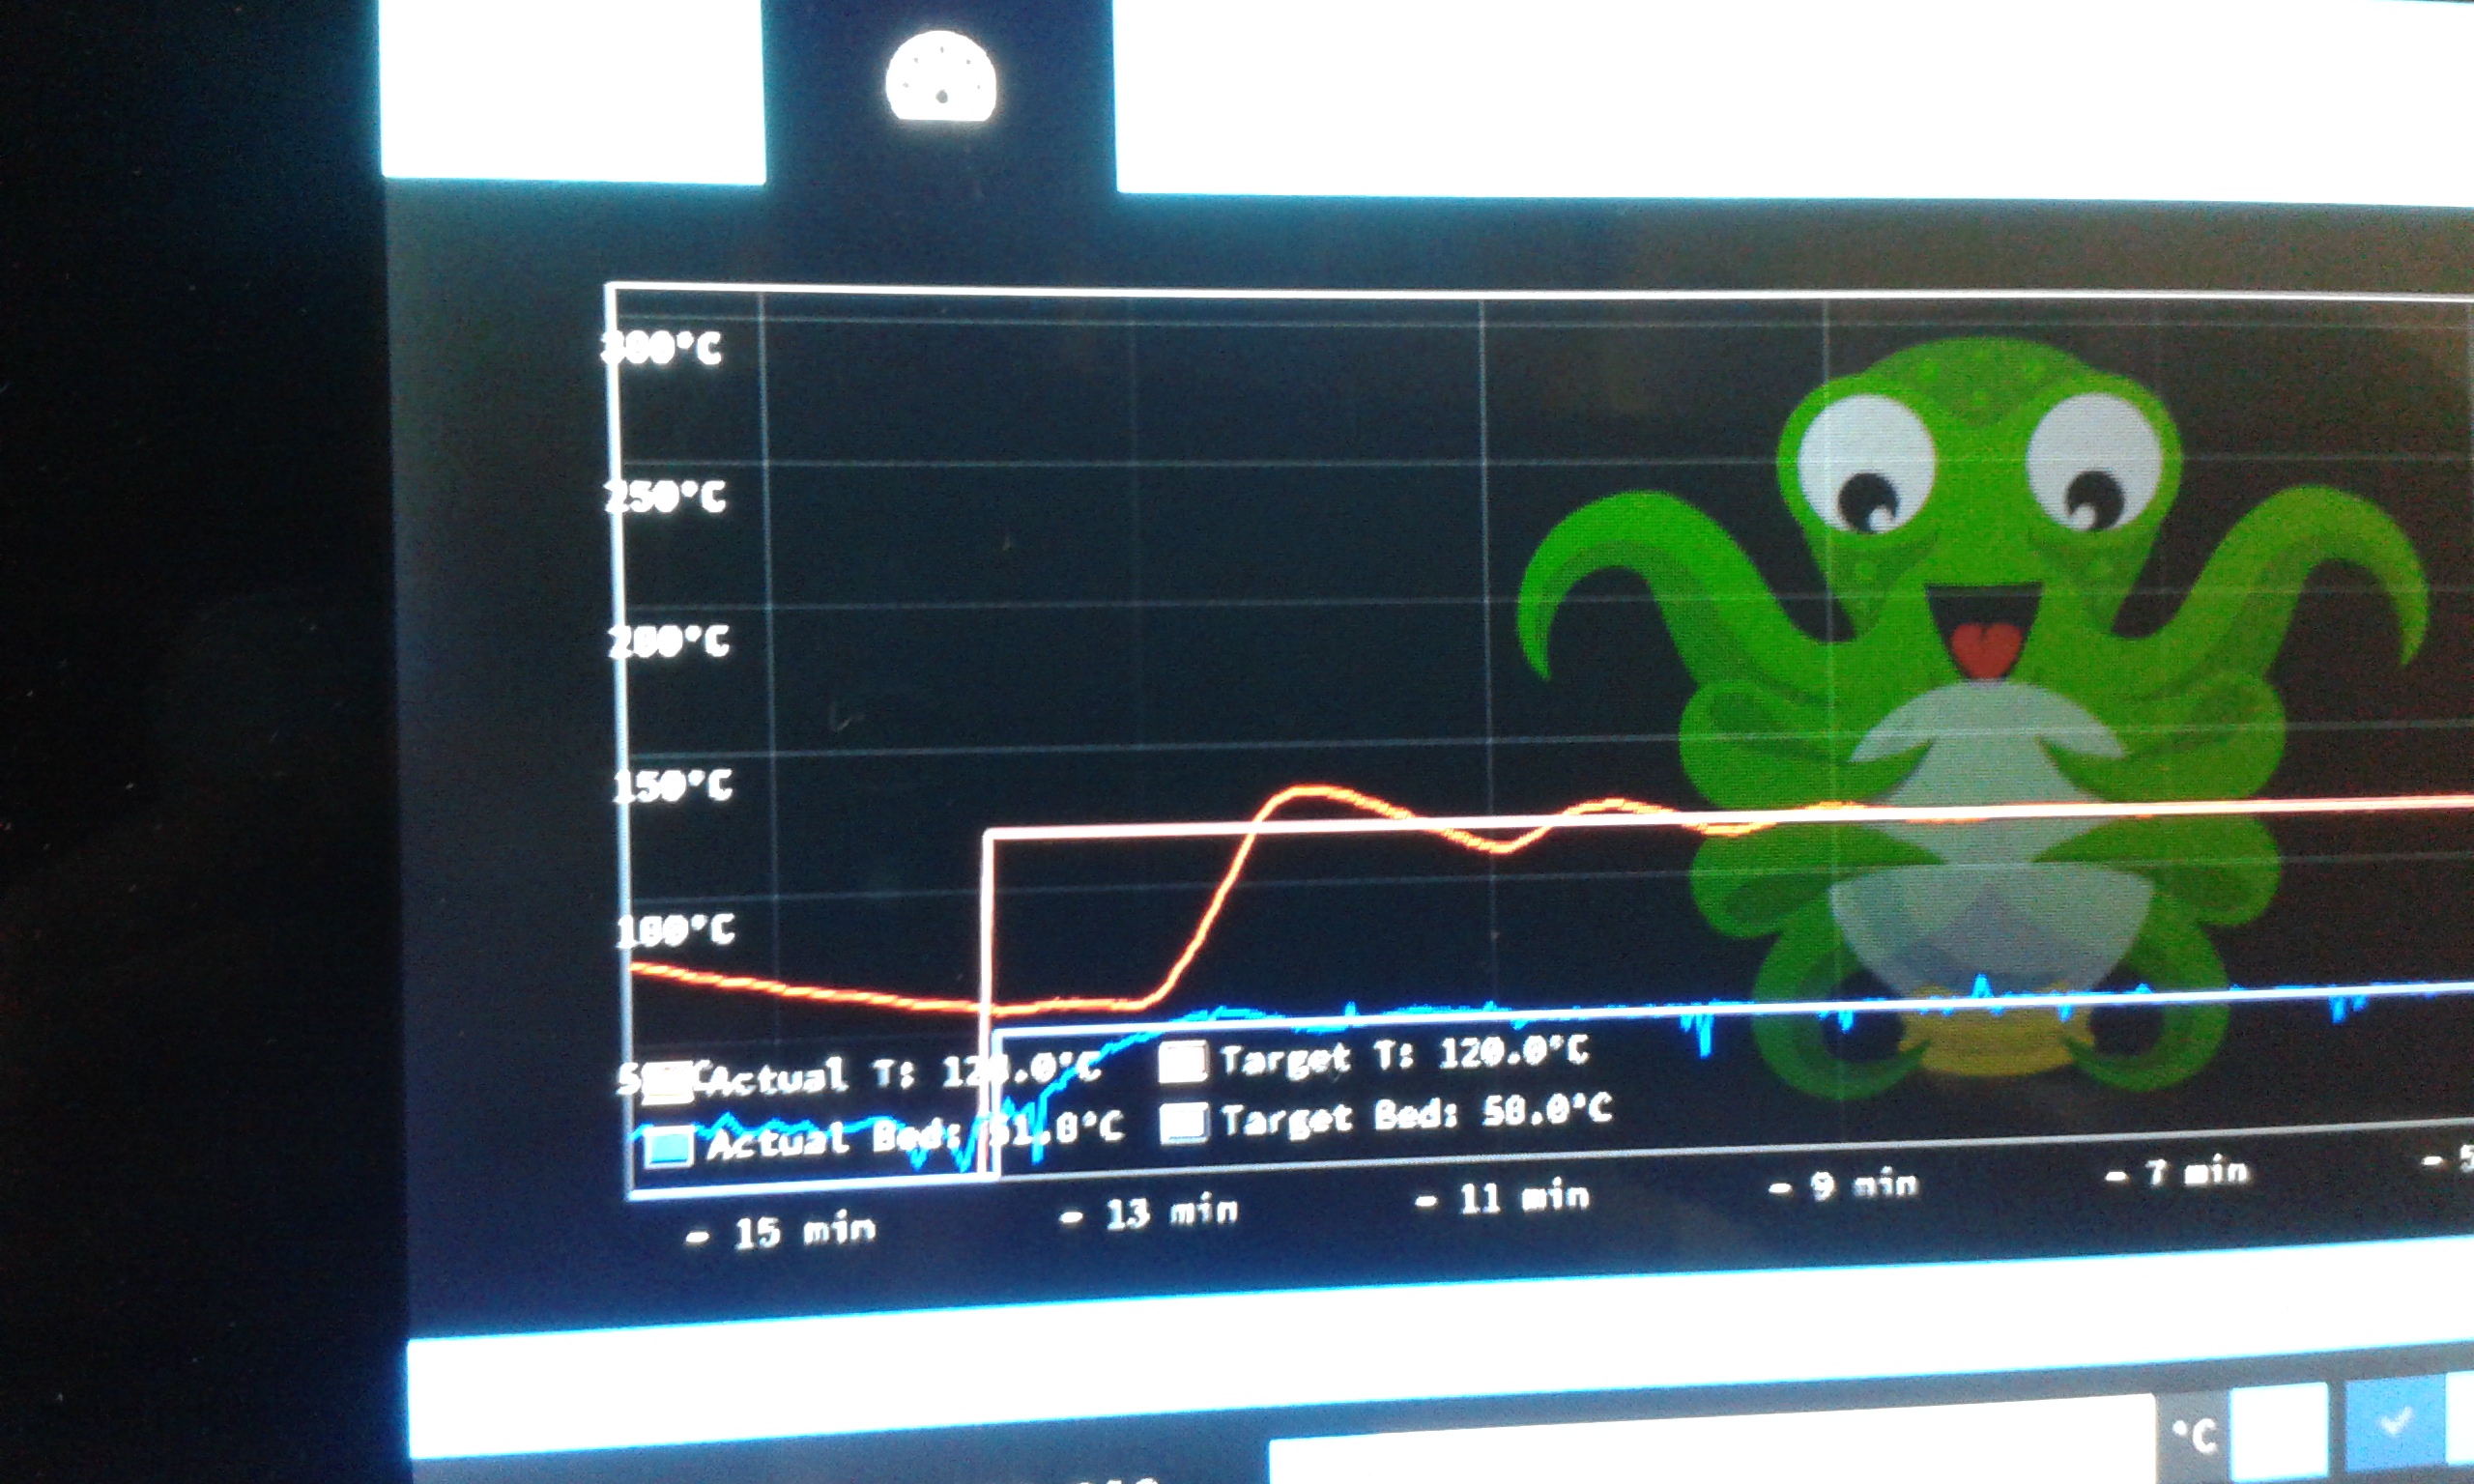
So my question is which file/line of text/code should I be concentrating on to get the background/canvas, think thats what it's referred too... to sit correctly so the temps sit out side the graph on the left vertical like they are supposed too?