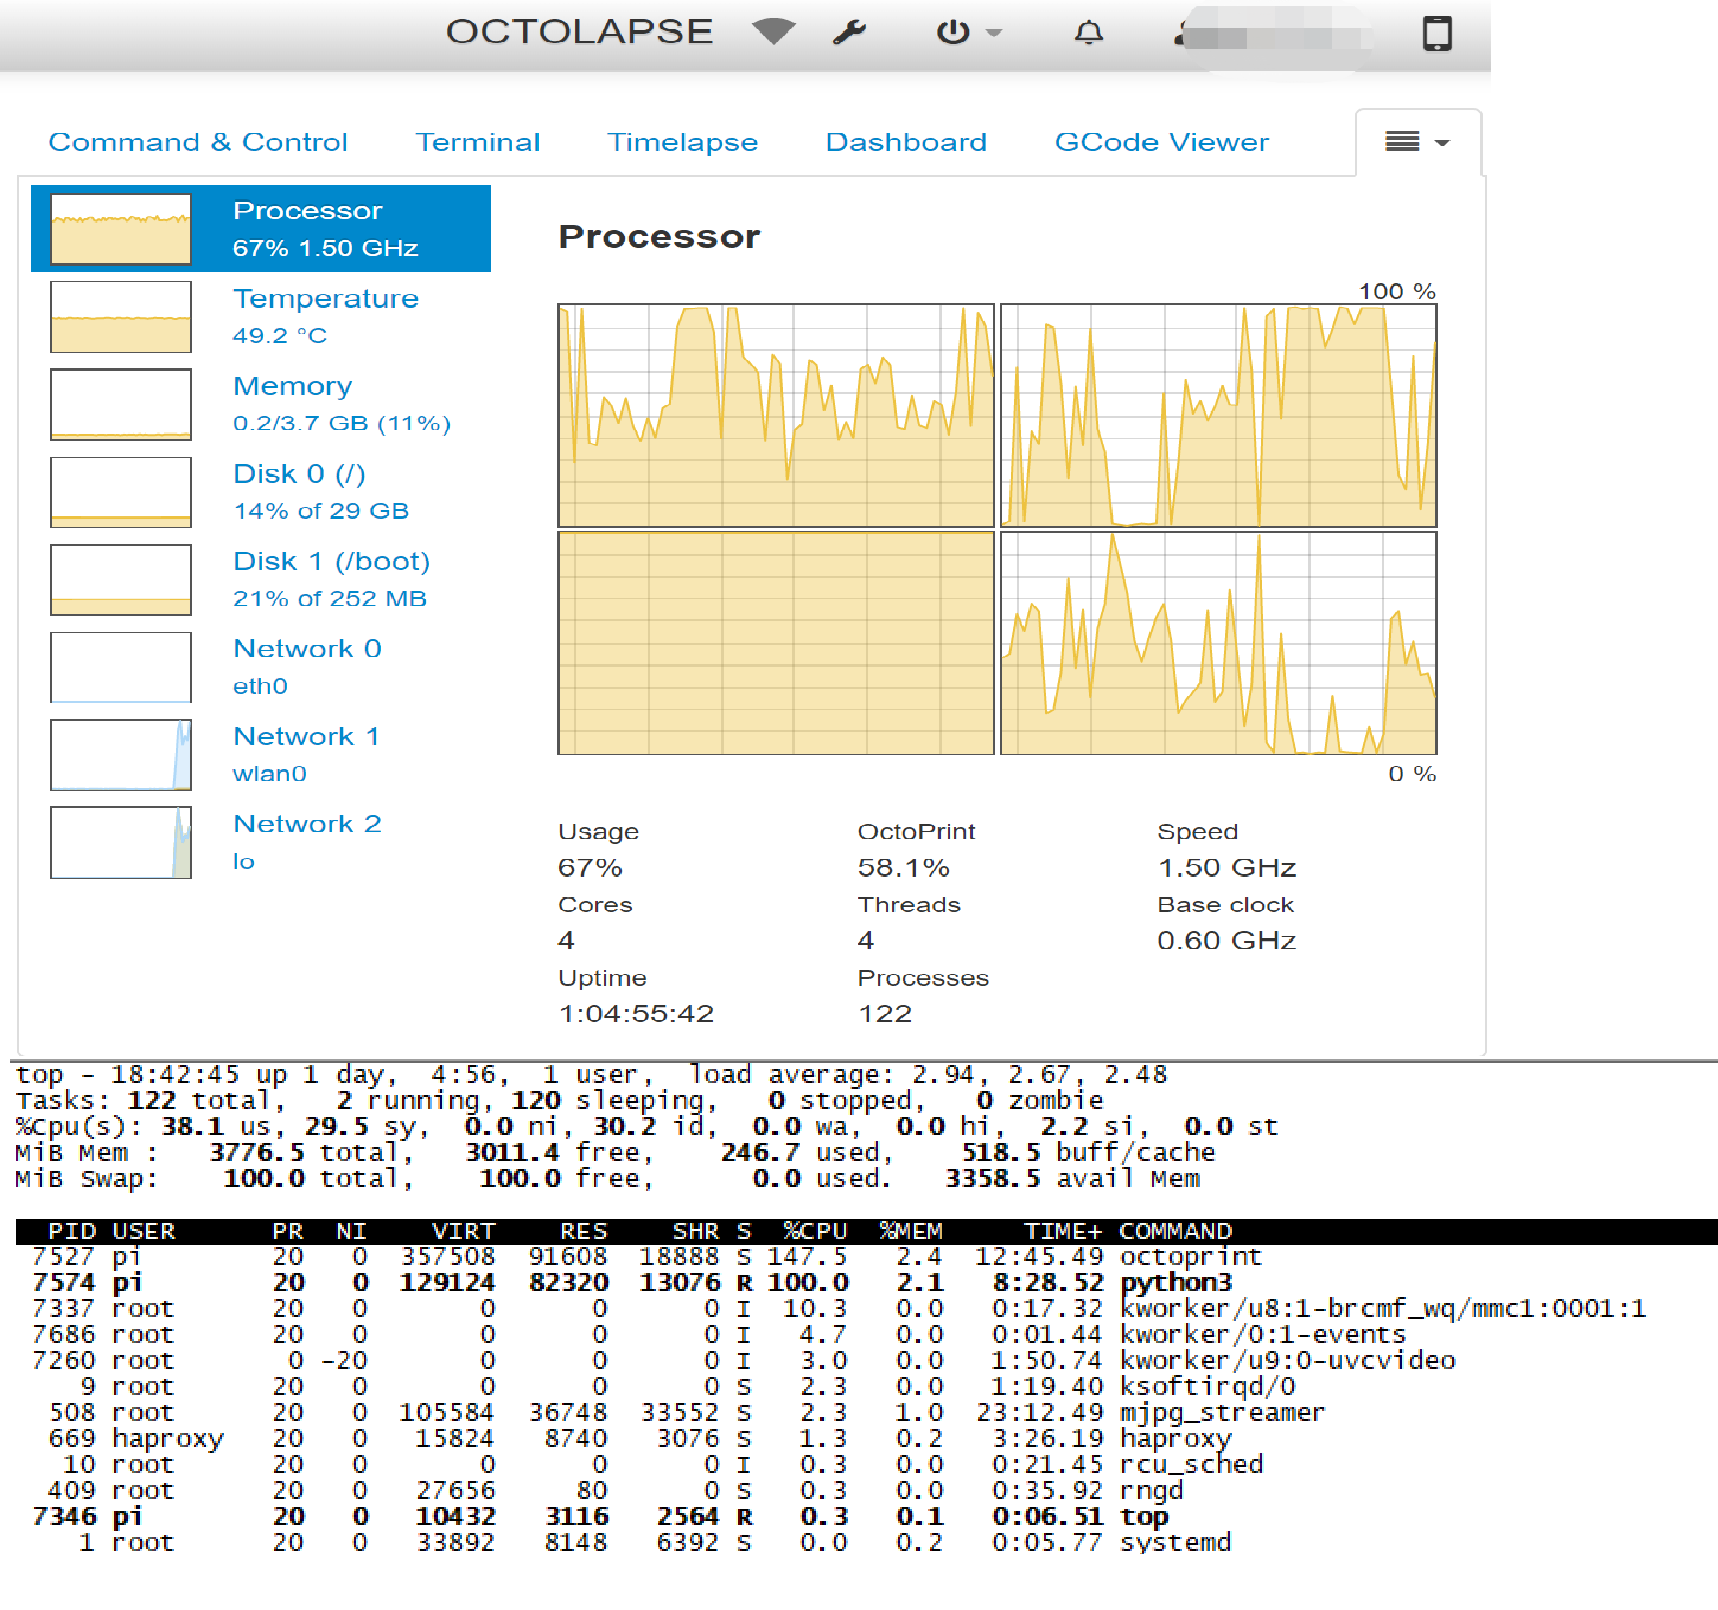
My gcode file size is about 70Mb. Recently, I found that after uploading the G-code file, the CPU utilization rate almost reaches 100%, and it has been maintained for a long time before it can return to the normal 7%
What did you already try to solve it?
If the size of the uploaded file is smaller, such as about 20Mb, this state will recover to 7% in about 30 seconds.
As fair as I know, OctoPrint performs some simple analysis of the gcode file to guess how long it is going to print for, the rough size of the design etc... It should stop slamming the cpu when you decide to start the print
N.B When you see a time estimation for your gcode file, the cpu usage should have reduced
N.B. 2 - Usage of 100% means that a single core of your CPU is fully used, but there are 4 of them on the Pi 4, so it should still have adequate performance for your needs
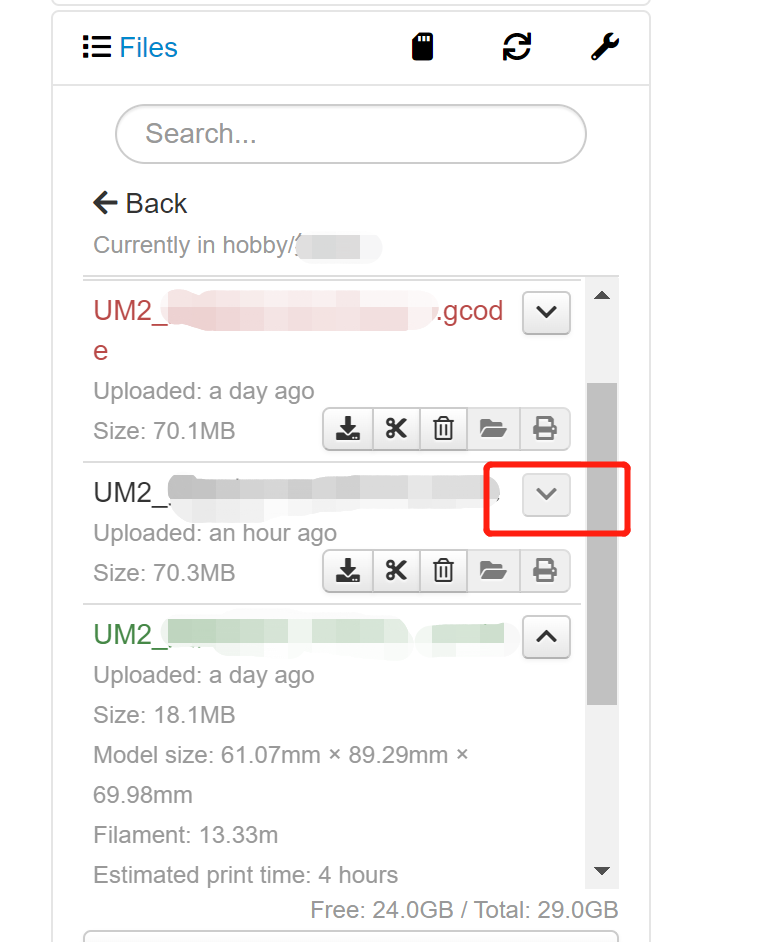
An hour has passed since I uploaded the G-code file. Click the file drop-down arrow. The arrow is gray and cannot display the printing time and other information.
I believe you were printing when submitting the analysis. Unfortunately I am therefore unable to see anything related to the gcode analysis.
However, is the cpu still high while the arrow is grey? Is it a gcode file?
It's definitely trying to gcode analysis according to the log files. There's no sign of it finishing the analysis in there. So I would say that's what is using the CPU time, trying to analyse the file. Maybe there is something wrong with the file, and it's making the gcode analysis take long time.
Through log file analysis, I found a large number of error messages as follows:
octoprint.filemanager.analysis - ERROR - Analysis for local:hobby/xxx/UM2_xxxV4X6(50mm).gcode ran into error: No analysis result found
Finally, I found a problem when I checked the G-code file. A large number of garbled codes in the g-code file are found, which should be the BUG of the slicer (Cura 4.12.1). It has nothing to do with octoprint.thanks to all.
Keep in mind that a SD card has a certain amount of write cycles.
When you always do the DEBUG (which is only necessary when a dev asks for it), the SD card will fail soon.
In addition, the octoprint.log will become quite huge and fill up the SD card quite fast.